|
IDER
|
INTERNATIONAL
DEVELOPMENT REPORTS year 2021
|
|
2021-4
|
Wages, Productivity and Quality of Life in France, Germany, Spain and the United States, 1960-2019 . Related article in Guisan(2021) in RSES (4)
|
|
2021-3
|
Industry, Education and Development in 53 African Countries, 1995-2019 (3)
|
|
2021-1
|
A Comparison of India, China and OECD Countries for 1950-2020 (2)
|
|
2021-1
|
Educarion and Development of 164 Countries for 1995-2019
|
The final versions of IDER reports of year 2021 are scheduled to be published in Guisan(2025 c) EcoDev 127 at Ideas.Repec. See Note of 30th July of 2026, at the end of this Entry, or Entry 66 of this Blog, with new links of year 2026 at SSRN and Minerva-USC.
Related articles in AEID and RSES:
(1) World Development For 1995-2020: Econometric Relationships Of Human Capital, Development, Quality Of Government And Life Satisfaction In 164 Countries, Guisan, M.C Abstract and article in AEID 21-1
(2) Employment by Sector and Development in India for 1950-2020 and International Compa-risons with China and OECD Countries, Guisan, M.C.Abstract and article in AEID 21-1.
(3) Industry, Education, Development and Quality Of Life In 53 African Countries, 1995-2020, Guisan, M.C., Exposito, P. Abstract
(4) Spanish and European Report 2021: Wages, Productivity, Quality of Public Sector and Citizens Satisfaction, Guisan M.C. (Abstract and article in English) (Article in Spanish)
Initial versions of IDER 21-1 to 21-4 (year 2021)
IDER 2021-1: World Development 1995-2019
Evolution in 24 years: Real production per capita increase in 6249 Dollars (at 2017 prices) in a period of 24 years (from 1995 to 2019), what implies an average of 260 Euros per year, but in the 2 groups of poorest countries the increase was very low with only 20 Euros per year in group 1).
1) Education and Development: Usually Education is the variable with the highest impact on economic development and quaality of life. The indicator Tyr10 is "Total years of schooling of adult population (+25 years old) in year 2010. The value varied between a low average of 3.38 years of Schooling in group 1 (lowest level of economic development) to 11,66 in group 9 (highest level of economic development). World average was 8.09.
2) Average Fertility rate: As seen in the econometric model of Guisan, Aguayo and Exposito (2021) (journal AEID Vol. 1-1), there is an important impact of Education in the moderation of average fertility rates. In table 1 we may notice that countries with the lowest levels of Schooling have high average Fertility rates (4.82 children per woman in group 1) while countries with high educational levels have moderate average Fertility rates (1.53 children per women in group 9).
3) Indicators of Quality of Life in a scale 0 (minimum) to 10 (maximum).
Indicator X1=Happiness varies from an average of 4.27 in group 1 to 7.07 in group 9, usually increasing with real income, health care access, working conditions, and other variables related with socio-economic development.
Indicator X2=Government Quality (calculated in the scale 0 to 10 from the World Bank data of Voice of citizens) varies from 3.12 in group 1 to 7.07 in grourp 9, usually increasin with socio-economic development.
Indicators X3 and X4 (X3=degree of conflict, X4=degree of peace). The average value of X3 varies between 6.00 in group 1 to 3.70, with many types of conflicts usually decreasing with socio-economic development. The average value of X4 varies between 4.00 in group 1 to 6.30 in group 9, usually increasing with socio-economic development.
Indicator XM is the mean of the indicators X1, X2 and X4. The average value varies between 3.79 in group 1 to 7.20 in group 9, usually increasing with socio-economic development.
Other contents of the Development Report: The main objetive of this report is to foster international cooperation in order to increase Schooling, Investment, Production per head and Quality of Life in the World, particularly in countries with the lowest levels.
We highlight the following table from the Report published in AEID 2021 by Guisan, M.C., which is free downloadable by clicking on "Abstract":
Source: Guisan , M.C. (2021). World Development For 1995-2020: Econometric Relationships of Human Capital, Development, Quality Of Government and Life Satisfaction In 164 Countries, Guisan, M.C Abstract
We may notice a positve evolution of Production per head, in the 9 groups of countries of the table for the period 1995-2019, but with great differences among the lowest and the highest values, both in 1995 and 2019. Countries of groups 1 to 5 were below World average in year 2019.
Countries with the highest levels of Education, with average years of School Atteinment of adult population higher than 10 years, are over the World average of Production per capita and also have good average values in other indicators: Between 6.07 and 7.07 average points for "Happiness"; average between 5.94 and 8.24 points in the indicator of Quality of Government (given by Voice of Citizens), between 5.47 and 6.30 for the indicator of Peace, and between 5.83 and 7.20 as average values of XM (being XM the meand of the indicators X1 (Happiness), X2 (Government Quality) and X4 (Peace).
IDER 21-2.
The following graphs show the increase of Production per head and Productivity per worker in India, China and OECD countries, for the period 1951-2000.
(Increase in Dollars at 1990 prices and purchasing parities)
Elaborated by Guisan((2021) in AEID (2021) with data from Maddison and World Bank.
The report and the related article published in AEID 21-1 expalin the important impact of Education and Industry on the evolution of Production per head and Productivity per workder.
IDER 21.3. Africa
The average production per capita in 35 African countries was below World average for the period 1995-2019. The average real value of Gross Domestic Product per capita in Africa evolved from 3849 in year 1995 to 6086 in 2019, while World average evolved from 9886 in 1995 to 16135 in year 2019.
The average years of schooling in Africa (4.78 years of schooling of adult population) was clearly below the World average (8.09) in year 2010). The empirical evidence show the positive impact that Education usually has in the moderation of excessively high fertility rates and in the increase of savings per capita, investment per capita and industrial production per capita, development and quality of life.
The comparison of Africa average with World average shows, in year 2019, a Fertility rate of 4.10 in Africa and 2.40 in the World. The indicators of quality of life X1(Life satisfaction), X2 (Quality of Government: Voice of Citizens) and X4 (Peace) of Africa were below World averages.
X1= 4.28 in Africa and 5.35 in the World
X2=3.50 in Africa and 5.0 in the World
X4=4.37 in Africa and 4.80 in the World
The comparison of real value-added per capita by sector, accordingly to the World Bank data, shows the following differences in year 2017:
QHA= Agriculture and Fishing: 592 in Africa, 766 in the World
QHI= Industry and Building: 1211 in Africa, 4771 in the World
QHS= Services: 2411 in Africa and 12149 in the World
Africal countries with the highest levels of QHI are usually those with with the highest levels of QHS and real GDP per capita.
Education contributes to favor savings and credits per capita and to increase industrial production per capita.
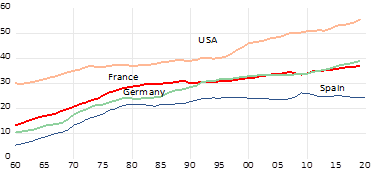
IDER 21-4. Wages, Productivity and Industry in France, Germany, Spain and the United States. International Report 1960-2019.
This graph shos the evolution of average real wages, expressed in thousand Dollars per worker at 2000 prices and exchange rates. Wages are calculated as the ratio between Compensation of Employes and number of Employees, and thus it includes social costs. that firms and worker pay, linked to the wages.
Graph: Real average wage in 4 countries for 1960-2019
(Dollars per employee at 2000 prices and exchange rates=
Source: Elaborated by Guisan from OECD statistics
Graph: Real Mean Productivity of labour (PM) in 4 countries
for 1960-2019 (Dollars per employee at 2000 prices and parities)
Source: Elaborated by M.C. Guisan(2021) from OECD statistics
Spain has the lowest level of average real wage, in this group of 4 countries, because it has also the lowest level in productivity per worker. It does not imply that the Spanish workers are not efficient, but that the country has the lowest level of industrial production per inhabitant. The empirical evidence of international studies confirm the Kaldor´s views that the increase of industrial production and productivity has positive effects on the productivity of other sectors and on real Gross Domestic Product per capita.
Spain is also the country of the group with lower resources devoted to Rsearch and Development, in this group.
The United States has kept, for all the period 1960-2020. a great advantage in comparison with these 3 European countries regarding real wages, producitiviy and development.
Note of 30th July of 2026
New Links to IDER21, 22, 23 and 24 in the series Economic Developmet of year 2025, at Minerva-USC and ISSN since August of 2026. More information at Entry 66 of this Blog.
Besides IDER reports and other working papers of the series EcoDev have been accesible thorugh Ideas-Repec (Abstracts and pdfs). Unfortunately since 4th May of 2026 only Abstracts are available at Ideas.Repec, because the link that communicate the hosting of pdfs at our university has been broken due to informatic changes. Pdfs are going to be available through Minerva and SSRN and we will try to recover the connection with Ideas.Repec.
A telephon version, of the Website sidebar: