Showing posts with label Quality of Life. Show all posts

2026/01/04

64. IDER 26-1: GDP per capita of 164 countries, 2019-2024 and quality of life


Section 1. GDP per capita. In the World, real Gross Domestic Product (GDP) per capita, has almost doubled for the period 1995-2024, in spite of a great increase in World Population (5,7 Billion people in 1995, 8,2 Billion people in 2024). GDP per capita evolved (at constant prices and parities of year 2021) from an average of 11429 in year 1995 to 19552 in year 2019 and 21405 in year 2024.

      The yearly rate of growth was higher for the period 1995-2019 (2.26%) than for the period 2019-2024 (1.83%).

Yearly Rate of Growth of GDP per capita for 2019-2024: The following tables show the Yearly Rate of growth of real GDP per capita, at 2021 prices and purchasing power parities, for the period 2019-2024. We classify countries into 5 groups accordingly to their level of GDP per capita in year 2019.

Group 1 includes countries with very high level of GDP per capita in year 2019 (over 50000 Dollars): 8 countries of this group has experienced a diminution of the variable, 15 countries a moderated growth below 2% and 3 countries had an average yearly rate higher than 2%. The highest rate corresponded to Ireland.


Group 2, includes countries with GDP per capita,, at 2021 prices, between 25000 and 50000 Dollars: 4 countries of the group experienced a negative yearly rate, many experienced a positive rate below 2% and 9 countries of the group experienced a rate higher than 4. The highest rate corresponded to Croatia and Turkiye


Group 3: it includes countries with GDP per capita in year 2019 around World average (between 15000 and 25000): 4 countries of this group experienced a negative rate, 10 countries had a positive rate below 2%, and 12 has a positive rate higher than 4%.  


Group 4. It includes countries below World average, with GDP per capita between 5000 and 15000 Dollars, at 2021 prices,  in year 2019. 


Group 5. Includes countries with very low valur of real GDP per capita


Summary: Yearly Rates of growth of GDP per capita 2019-2024

This report was addressed to update the information of the 164 countries analyzed in Guisan(2021) until year 2024. We distinguish several situations:

1) No data.  In 3 countries not available data for 2024: Afghanistan, Lebanon and Tonga
 2) Negative Yearly rate: In 41 countries there was a negative rate of variation of real GDP per capita for the period 2019-2024, as follows:
   8 countries of Group 1: Austria, Canada, Finland, Germany. Kuwait, Luxembourg, Qatar, United Arab Emirate (UAE).
   4 countries of Group 2: Estonia, Oman, Seychelles, Trinidad&Tobago.
   4 countries of Group 3: Botswana, Equatorial Guinea, Gabon, Ukraine. 
   14 countries or territories in Group 4: Angola, Bolivia, Congo R, Iraq, Libya, Mianmar, Namibia, Nigeria, Sao Tome&Principe, South Africa, Sri Lanka, Timor Leste, Tunisia, West Bank&Gaza
11 countries in Group 5: Burundi, Central African R, Chad, Haiti, Lesotho, Madagascar, Malawi, Mali, Mozambique, Papua-New Guinea, Sudan.

3) Positive and moderate Yearly rate of growth of GDP per capita, between 0% and 2%, n 69 countries:
   15 countries and territories of Group 1
   21 countries of Group 2
   10 countries of Group 3
   15 countries of Group 4
   8 countries of Group 5
4) Positive and high Yearly rate of growht of GDP per capita, between 2% and 4% in 31 countries

   2 countries of Group 1: Bermuda, Malta
   7 countries of Group 2: Bulgaria, Cyprus, Greece, Korea R, Poland, Romania, Russian F.
   6 countries of Group 3: Bosnia&Herzegovina, Costa Rica, Dominican R, Egypt AR, Montenegro, North Macedonia
   5 countreis of Group 4: Bangladesh, India, Indonesia, Iran IR, Viet Nam
   11 countries of Group 5: Benin, Congo DR, Ethiopia, Gambia, Guinea, Guinea-Bissau, Niger, Togo,Uganda, Zambia, Zimbabwe
   
5) Positive and very high Yearly rate between 4% and 6% in 15 countries
   1 couuntry in Group 1: Ireland
   2 countries in Group 2: Croatia and Turkiye
   4 countries in Group 3: Albania, Armenia, China, Serbia.
   6 countries in Group 4: Bangladesh, Djibouti, India, Indonesia, Iran IR, Vietnam
   2 countries in Group 5: Rwanda, Tajikistan
6) Positive and excepcionally higher Yearly rate, higher than 6% in 2 countries:
   1 country in Group 3: Georgia
   1 country in Group 6: Guyana

An overview of economic development for 2021-2024:

44 countries had negative yearly rate (41) or not available (3)
69 countries had a low positive rate (0% to 2%)
31 countriss had a high positive rate (2% to 4%)
18 countries had a very high positive rate: between 4% and 5% (16 countries) or higher than 6% (2 countries).

The balance is that only 49 out of 164 countries (around 30%) had a high or  very high positive yearly rate of growth of GDP.

51 countries of Groups 4 and 5, with GDP in year 2019 below 15000 Dollars at 2021 prices, have not experienced increases higher than 2% for the period 2019-2024: 26 with a decrease, 2 not available data, 23 with increase lower than 2%.
27 countries of Groups 4 and 5, experienced an increase higher than 2% for the period 2019-2024.

Thus 75%, out of the 68 countries of Groups 4 and 5, experienced not growth or moderate growth, and only 25% experienced a yearly increase higher than 2% for the period 2019-2024.

Better economic policies are possible and necessary to reach better economic opportunities in the World.


Section 2. Quality of Life: Indicator of Happiness (WHR2025)

 World Happiness Report 2025 presents data for 147 countnries of the Happiness index (decimal scale with 0 minimum and 10 maximum) in year 2024, and the change for the period 2012-2024.

   We presenta summary.
Top 14 countries with Happiness indicator higher that 6.9 in year 2024 where, in alphabetical order:
Australia, Belgium, Costa Rica, Denmark, Finland, Iceland, Israel, Luxembourg, Mexico, Netherlands, New Zealand, Norway, Sweden, Switzerland
They occupy the best positions, but 10 out of 14 of these countries have experencied a diminution of the Happiness index for the period 2012-2024.
Ranking 1 to 25 (Index higher than 6.7) in the WHR Happiness data for 2024, include, besides the top 14 abovementioned,  the following ones, with Index higher than 6.7 (in alphabetical order): Austria, Belize, Canada, Czechia, Germany, Ireland, Lithuania, Slovenia, UA Emirates, UK, United States,

Ranking 26 to 50 (index between 6.22 and 6.69), in alphabetical order: Argentina,  Brazil, Chile, El Salvador, Estonia, France, Guatemala, Italy, Kazahstan, Kosovo, Kuwait, Malta, Nicaragua, Panama,  Poland, Romania, Saudi Arabia, Serbia, Singapore, Slovakia, Spain, Taiwan, Thailand, Uruguay, Viet Nam, 

Ranking 51 to 75 (index between 5.85 and 6.21), in alphabetical order: Bahrain, Bolivia, Bosnia-Herzegovina, China, Colombia, Croatia, Cyprus, Ecuador, Honduras, Hungary, Jamaica, Japan, Korea R, Kyrgyzstan, Latvia, Malaysia, Montenegro, Oman, Paraguay, Peru,  Philippines,  Portugal, Russian Fed., Trinidad&Tobago, Uzbekistan,

Ranking 76 to 100 (index between 5.01 and 5.849), in alphabetical order: Albania, Algeria, Armenia, Bulgaria, Congo R, Cote d´Ivore, Dominican R, Gabon, Georgia, Greece, Hong-Kong(China), Indonesia, Iran, Lao PDR, Libya, Mauritius, Moldava R, Mongolia, Mozambique, Nepal, North Macedonia, South Africa, Tajikistan, Turkiye, Venezuela.

Ranking 101 to 125 (index between 4.33 and 5.0), in alphabecial order: Azerbaiyan, Benin Burkina-Faso, Cambodia, Cameroon, Chad, Gambia, Ghana, Guinea, India, Irak, Kenya, Mali, Mauritania, Morocco, Namibia, Niger, Nigeria, Pakistan, Senegal, Somalia, Tunisia, Uganda, Ukraine, West Bank&Gaza (Palestine), 

Ranking 126 to 147 (index between 1.3 and 4.32), in alphabetical order: Afghanistan, Bangladesh, Benin, Botswana, Cambodia, Comoros, Congo DR, Egypt, Eswatini, Ethiopia, Ghana, Jordan, Lebanon, Lesotho, Liberia, Madagascar, Malawi, Mali, Myanmar, Sierra Leone, Somalia, Tanzania Sri Lanka, Togo, Yemen, Zambia, Zimbabwe.
Besides, de 147 countries included in the WHR Report, we can add, an estimation for Cuba, based on Statistica data, around 4.01.

Evolution of 2012-2024;
Countries in ranking 1 to 25 have experienced a diminution in 14 otu of 25.
Countries in ranking 26 to 50 have experienced a dminution in 6 out of 25
Countries in ranking 51 to 75 have experienced a diminution in 6 out of 25
Countries in ranking 76 to 100 have experienced a diminution in 2 out of 25
Countries in ranking 101 to 125 have experienced a diminution in 7 out of 25
Countries in ranking 126 to 147 have experienced a diminution in 17 out of 21

It is really sad to notice diminutions in quality of life, particularly in countries with very low levels of development and quality of life.

The countries with the lowest levels in year 2024 (hapiness index below 4), where 17,  in alphabetical order:

Afghanistan, Bangladesh, Botswana, Comoros, Congo DR, Ethiopia, Egyp AR, Eswatini, Lebanon, Lesotho, Malawi, Sierra Leone, Sri Lanka, Tanzania, Yemen, Zambia, Zimbabwe.

    
Section 3. Selected readings on Development of 164 countries, 1995-2024:

The journal AEID (Applied Econometrics and International Development) has published several interesting articles on World Development of 164 countries, like the following ones, which are free downloadable at Ideas.Repec, by clicking on "Abstract" of each article:

Development and Financial Indicators in 164 countries: Analysis of causality for 2021. GUISAN, Maria-Carmen Abstract   (AEID 24-1)

Political Stability, Peace And Economic Development In 164 Countries, 2010-2020, Guisan, M.C.  Abstract (AEID 22-1)

World Development For 1995-2020: Econometric Relationships Of Human Capital, Development, Quality Of Government And Life Satisfaction In 164 Countries, Guisan, M.C   Abstract  (AEID 21-2)

Those articles include analysis of econometric relationships and data for the variables. 

The article by Guisan(2021), in AEID 21-2, includes data and analysis of GDP per capita, of each country,  at 2017 prices and parities, for 1995-2019, as well as indicators of Education, Fertility, Happiness, Quality of Government, Peace and Homicides rate.

This report by Guisan(2026) will include, at a Document of the Series Economic Development,  data and analysis of GDP per capita, of each country, at 2021 prices and parities, for 2019-2024, as well as an analysis of some indicator of quality of life for that period.
Entry to be updated in the next weeks.


2022/01/18

46. IDER 21-1 to 21-4. Education, Production and Quality of Life in 164 countries, 1995-2019 and other international development seports


     IDER are International Development Economic Reports: Reports published by the Euro-American Association of Economic Development Studies since year 2021. Provisional versions for each year are published in this Blog and afterwards published in the working paper series EcoDev of the Research Team of Econometrics of the Faculty of Economics of the university of Santiago de Compostela (Spain). 

Update of 30th July of 2026

IDER reports of years 2021 to 2024 have been published in EcoDev 127 to 130.  See new links at Entry 66 of this Blog.


Initial version 25-12-2022. Updated 11th September 2024.

IDER reports of year 2021 is scheduled to be published in EcoDev 127 in year 2025 

IDER

INTERNATIONAL DEVELOPMENT REPORTS year 2021

2021-4

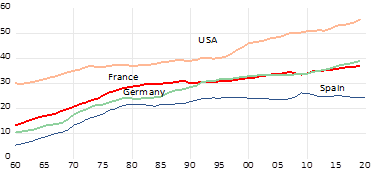
Wages, Productivity and Quality of Life in France, Germany, Spain and the United States,  1960-2019 . Related article in Guisan(2021) in RSES (4)

2021-3

Industry, Education and Development in 53 African Countries, 1995-2019  (3)

2021-1

A Comparison of India, China and OECD Countries for 1950-2020  (2)

2021-1

Educarion and Development of 164 Countries for 1995-2019

The final versions of IDER reports of year 2021 are scheduled to be published in Guisan(2025 c) EcoDev 127 at Ideas.Repec. See Note of 30th July of 2026, at the end of this Entry, or Entry 66 of this Blog, with new links of year 2026 at SSRN and Minerva-USC.


Related articles in AEID and RSES:


(1) World Development For 1995-2020: Econometric Relationships Of Human Capital, Development, Quality Of Government And Life Satisfaction In 164 Countries, Guisan, M.C   Abstract and article in AEID 21-1

(2) Employment by Sector and Development in India for 1950-2020 and International Compa-risons with China and OECD Countries, Guisan, M.C.Abstract and article in AEID 21-1.


(3) Industry, Education, Development and Quality Of Life In 53 African Countries, 1995-2020, Guisan, M.C., Exposito, P.  Abstract


(4) Spanish and European Report 2021: Wages, Productivity, Quality of Public Sector and Citizens Satisfaction, Guisan M.C. (Abstract and article in English) (Article in Spanish)


 Initial versions of IDER 21-1 to 21-4 (year 2021)


             IDER 2021-1: World Development 1995-2019

 Evolution in 24 years:  Real production per capita increase in 6249 Dollars (at 2017 prices) in a period of 24 years (from 1995 to 2019), what implies an average of 260 Euros per year, but in the 2 groups of poorest countries the increase was very low with only 20 Euros per year in group 1). 


      1) Education and Development: Usually Education is the variable with the highest impact on economic development and quaality of life. The indicator Tyr10 is "Total years of schooling of adult population (+25 years old) in year 2010. The value varied between a low average of 3.38 years of Schooling in group 1 (lowest level of economic development)  to 11,66 in group 9 (highest level of economic development). World average was 8.09.


      2) Average Fertility rate: As seen in the econometric model of Guisan, Aguayo and Exposito (2021) (journal AEID Vol. 1-1), there is an important impact of Education in the moderation of average fertility rates. In table 1 we may notice that countries with the lowest levels of Schooling have high average Fertility rates (4.82 children per woman in group 1) while countries with high educational levels have moderate average Fertility rates (1.53 children per women in group 9). 


        3) Indicators of Quality of Life in a scale 0 (minimum) to 10 (maximum). 

Indicator X1=Happiness varies from an average of 4.27 in group 1 to 7.07 in group 9, usually increasing with real income, health care access, working conditions, and other variables related with socio-economic development. 

Indicator X2=Government Quality (calculated in the scale 0 to 10 from the World Bank data of Voice of citizens) varies from 3.12 in group 1 to 7.07 in grourp 9, usually increasin with socio-economic development.

Indicators X3 and X4 (X3=degree of conflict, X4=degree of peace). The average value of X3 varies between 6.00 in group 1 to 3.70, with many types of conflicts usually decreasing with socio-economic development. The average value of X4 varies between 4.00 in group 1 to 6.30 in group 9, usually increasing with socio-economic development. 


Indicator XM is the mean of the indicators X1, X2 and X4. The average value varies between 3.79 in group 1 to 7.20 in group 9, usually increasing with socio-economic development. 


Other contents of the Development Report: The main objetive of this report is to foster international cooperation in order to increase Schooling, Investment, Production per head and Quality of Life in the World, particularly in countries with the lowest levels.


We highlight the following table from the Report published in  AEID 2021 by Guisan, M.C., which is free downloadable by clicking on "Abstract":


 Source: Guisan , M.C. (2021). World Development For 1995-2020: Econometric Relationships of Human Capital, Development, Quality Of Government and Life Satisfaction In 164 Countries, Guisan, M.C   Abstract

                  We may notice a positve evolution of Production per head,  in the 9 groups of countries of the table for the period 1995-2019, but with great differences among the lowest and the highest values, both in 1995 and 2019. Countries of groups 1 to 5 were below World average in year 2019. 

            Countries with the highest levels of Education, with average years of School Atteinment of adult population higher than 10 years, are over the World average of Production per capita and also have good average values in other indicators: Between 6.07 and 7.07  average points for  "Happiness"; average between 5.94 and 8.24 points in the indicator of Quality of Government (given by Voice of Citizens), between 5.47 and 6.30 for the indicator of Peace, and between 5.83 and 7.20 as average values of XM (being XM the meand of the indicators X1 (Happiness), X2 (Government Quality) and X4 (Peace).

IDER 21-2.

The following graphs show the increase of Production per head and Productivity per worker in India, China and OECD countries, for the period 1951-2000. 
        (Increase in Dollars at 1990 prices and purchasing parities)
       Elaborated by Guisan((2021) in AEID (2021) with data from Maddison and World Bank.

     The report and the related article published in AEID 21-1 expalin the important impact of Education and Industry on the evolution of Production per head and Productivity per workder.

IDER 21.3. Africa

The average production per capita in 35 African countries was below World average for the period 1995-2019. The average real value of Gross Domestic Product per capita in Africa evolved  from 3849 in year 1995 to 6086 in 2019, while World average evolved from 9886 in 1995 to 16135 in year 2019. 

The average years of schooling in Africa (4.78 years of schooling of adult population) was clearly below the World average (8.09) in year 2010). The empirical evidence show the positive impact that Education usually has in the moderation of excessively high fertility rates and in the increase of savings per capita, investment per capita and industrial production per capita, development and quality of life.

The comparison of Africa average with World average shows, in year 2019, a Fertility rate of 4.10 in Africa and 2.40 in the World. The indicators of quality of life X1(Life satisfaction), X2 (Quality of Government: Voice of Citizens) and X4 (Peace) of Africa were below World averages. 
X1= 4.28 in Africa and 5.35 in the World
X2=3.50 in Africa and 5.0 in the World
X4=4.37 in Africa and 4.80 in the World

The comparison of real value-added per capita by sector, accordingly to the World Bank data, shows the following differences in year 2017:
QHA= Agriculture and Fishing: 592 in Africa, 766 in the World
QHI= Industry and Building: 1211 in Africa, 4771 in the World
QHS= Services: 2411 in Africa and 12149 in the World

Africal countries with the highest levels of QHI are usually those with with the highest levels of QHS and real GDP per capita.
Education contributes to favor savings and credits per capita and to increase industrial production per capita.

IDER 21-4. Wages, Productivity and Industry in France, Germany, Spain and the United States. International Report 1960-2019.

This graph shos the evolution of average real wages, expressed in thousand Dollars per worker at 2000 prices and exchange rates. Wages are calculated as the ratio between Compensation of Employes and number of Employees, and thus it includes social costs. that firms and worker pay, linked to the wages.

   Graph: Real average wage in 4 countries for 1960-2019
     (Dollars per employee at 2000 prices and exchange rates=

Source: Elaborated by Guisan from OECD statistics

    Graph: Real Mean Productivity of labour (PM) in 4 countries
     for 1960-2019 (Dollars per employee at 2000 prices and parities)

       Source: Elaborated by M.C. Guisan(2021) from OECD statistics


Spain has the lowest level of average real wage, in this group of 4 countries, because it has also the lowest level in productivity per worker. It does not imply that the Spanish workers are not efficient, but that the country has the lowest level of industrial production per inhabitant. The empirical evidence of international studies confirm the Kaldor´s views that the increase of industrial production and productivity has positive effects on the productivity of other sectors and on real Gross Domestic Product per capita. 
Spain is also the country of the group with lower resources devoted to Rsearch and Development, in this group.
The United States has kept, for all the period 1960-2020. a great advantage in comparison with these 3 European countries regarding real wages, producitiviy and development.

Note of 30th July of 2026
New Links to IDER21, 22, 23 and 24 in the series Economic Developmet of year 2025, at Minerva-USC and ISSN since August of 2026. More information at Entry 66 of this Blog.

Besides IDER reports and other working papers of the series EcoDev have been accesible thorugh Ideas-Repec (Abstracts and pdfs). Unfortunately since 4th May of 2026 only Abstracts are available at Ideas.Repec, because the link that communicate the hosting of pdfs at our university has been broken due to informatic changes. Pdfs are going to be available through Minerva and SSRN and we will try to recover the connection with Ideas.Repec.


 A telephon version, of the Website sidebar: 


2021/02/23

45. Women´s Quality of Labour, Social Visibility and Quality of Life. Euro-American Report year 2020


Here we present a short version of section 4 of the article by Guisan and Aguayo(2020)

4. Quality of Labour, female social visibility and quality of life.


Entry 45  by Maria-Carmen Guisan, Professor of Econometrics, Spain

4.1. Quality of labour and its impact on quality of life

     Women workers lifes are sometimes more stressed than lifes of men workers, due to the problems to conceal family life and labour hours. The consequence is that women workers usually have fewer hours of leisury activities per week. In spite of that, the majority of women are happy to find a job, with quality of labour, not only because paid work provides some degree of income and independence, but also because it allows to develop social and personal values and, in many cases, also vocational jobs.

      Quality of labour is an important part of quality of life. It is interesting to know the evolution for the period 2007-2019. Besides the diminution of average wage for the period 2009-2019 some indicators show that other aspects of quality of labor (stability, opportunities, good environment, flexibility of hours, etc.) seem to have diminished. There has been an increase of presentialism and a diminution of opportunities for tele work in many public and private employments. In year 2020 with the pandemia, there has been an important increase of tele work, which diminishes the travel time to work, increases flexibility and helps to conceal family and labor lifes.

   The problems of conciliation of family life and working life is common in many countries, particularly for women with little children. Availability of public services for children care, family help (from husband, parents or other relatives) or the affordability to pay for private services are of great help but not always are easy to find for many women.

    Indicators in EU28: Perez-Ortiz et al (2020b) present an interesting graph for Female Global Index (horizontal axis) and Male Global Index (vertical axis) and draw the bisector in the first quadrant in 23 European Union countries. We highlight the following results od the Global Index of quality of labour by gender:

 1) At the bottom, with Index below 50 for Female and below 55 for Male Employment: Greece, Poland, Latvia, Lithuania, Estonia, Hungary, Slovakia, Spain and Italy. 

2) A second group with Index highet than 50 and below 60 for women and below 65 for men: Czech R, Portugal, Germany, France, Ireland, UK, Luxembourg, Slovenia and Belgium. 

3) A third group, with the highest values of the Global Index of quality of labour includes 5 countries with both Female and Male Indexes between 60 and 70: Belgium, Austria, Finland, Denmark and Sweden. 4) The coordinates of most of countries are over the bisector of the first quadrant, as to say the quality of labor is usually higher for men than for women.


4.2 Social visibility of notable women

As seen in Guisan, Aguayo and Exposito (2011), and other studies, there are several interesting articles on the Female difficulties to reach opportunities of promotion and visibility particularly in several environments of traditional Male power. Here we can add information about several problems and some interesting initiatives.

 1) Newspapers, radios and televisions.

 In year 2008 only 6% of women in interviews to professional experts and 10% to political members. Only 21% of opinion journalists, accordingly to the II report ColumnistAs, by Plann. In the ColumnistA study, prepared by the consulting firm Planner Media with the support of the Federation of Associations of Journalists of Spain (FAPE), where it analyzes more than 3,000 pieces of opinion with about 1,500 different columnists, from 26 media outlets, it shows that Only 21% of the opinion columns published by the Spanish media are signed by women and, in the case of opinion columns dedicated to scientific issues, the percentage signed by women drops to 7%.

A study financed by the Women´s Departament of the Autonomuys Community of Madrid, Mateos de Cobo et al (2007) published an analysis of digital press in Spain regarding gender stereotips.

For the last decades, a greater number of women journalists interested on Female visibility, as well as an increasing number of men, has contributed to changes in the contents of newspapers and other means of communication, with more interviews or news on outstanding women in fields of science, literature, economy, politics, and other ones. But already there is the feeling of "being invisible" for many notable women.

2) Associations that support Women in Science, Tecnology, and Executive positions.

The visibility of women in any area of ​​society and particularly in those of research and technology is an aspect of great importance to refute the false argument that "there are no women" or "there are no brilliant women" in the different fields of knowledge (Lopez et al, 2020). .

3) Encyclopedias and texbooks.

     The presence of women in Encyclopedias and Bibliographic Dictionaries is usually very low, with percentages of 6% or below in many fields, where they have had a remarkable higher activity. Although there are a few publications that collect biographies of some relevant women they usually are not available in internet at a low cost or free.

     The scarce inclusion of relevant women in Wikipedia is analyzed in the interesting academic article by Li(2020) and in outstanding articles in newspapers and blogs.

      Noan Cohen(2011) have published an interesting article in the New York Times (NYT) about the gender gap in contributors lists of Wikipedia:

Define Gender Gap? Look Up Wikipedia’s Contributor List. "According to the OpEd Project, an organization based in New York that monitors the gender breakdown of contributors to “public thought-leadership forums,” a participation rate of roughly 85-to-15 percent, men to women, is common — whether members of Congress, or writers on The New York Times and Washington Post Op-Ed pages. It would seem to be an irony that Wikipedia, where the amateur contributor is celebrated, is experiencing the same problem as forums that require expertise."

Sue Gardner(2011).She was the executive director of the Wikimedia Foundation from December 2007 until May 2014, and has written the interesting article at her Blog related with the publication by Norma Cohen:

Nine Reasons Women Don’t Edit Wikipedia (in their own words). We list the 9 reasons in the Annex, and we highlight reason 4 and 9 as important not only for explain the gender gap in contributions to the Encyclopedia but also the gender gap in the biographical contents of notable women. Reason 4) is "Some women don’t edit Wikipedia because they are conflict-averse and don’t like Wikipedia’s sometimes-fighty culture". Reason 9) is "Some women don’t edit Wikipedia because social relationships and a welcoming tone are important to them, and Wikipedia offers fewer opportunities for that than other sites".

      Shlomit Lir (2020), also points to the unfriendly environment that many women find when they wish to include, in Wikipedia, contents related with women, in the article:

Strangers in a seemingly open-to-all website: the gender bias in Wikipedia Equality, Diversity and Inclusion: "Findings – The findings show that having the will to edit and the knowledge of how to edit are necessary but insufficient conditions for women to participate in Wikipedia. The finding reveals two categories: pre-editing barriers of negative reputation, lack of recognition, anonymity and fear of being erased; and post-editing barriers of experiences of rejection, alienation, lack of time and profit and ownership of knowledge. The research suggests a “Vicious Circle” model, displaying how the five layers of negative reputation, anonymity, fear, alienation and rejection – enhance each other, in a manner that deters women from contributing to the website"

     Although Wikipedia has very good contributors, male and female, in many topics, the question is that the rules for contributors are not all good, and they should be improved in order to avoid lack of protection for women, or other contributors, when they find hostility barriers to publish qualified and interesting contents.

     In biographic Encyclopedias and textbooks, the presence of women is usually very scarce and clearly below their professional, artistic or scientific activity. Accordingly.

     An study by López-Navajas(2014) from the University of Valencia, presents data of female protagonism by subject of study in Secondary Education textbooks in Spain and show that only 7.5% of the referents in those text book are women.

3) Blogs and twitter: initiatives for women visibility.

An interesting initiative from Lydia Gil is her Blog of social media investigation : https://socialmediaeninvestigacion.com/mujeresdivulgadoras-edicion3

It is an interesting initiative for visibiligy of women communicators in Sciences (natural Sciences, Social sciencias and other fields). She also contributes to the women visibility on radio program "Ones of science". In the Annex we will include other Blogs.

It is worth highlighting initiatives such as the Women with Science blog, from the Chair of Scientific Culture of the University of the Basque Country, which tries to give greater visibility to women who contributed and contribute to progress in different scientific and technological fields, linked to STEM disciplines (Science, Technology, Engineering and Mathematics).

In the field of social sciences, the Women in Economics network formed in 2019 from the twitter account @mujereseneco addresses the objective of promoting presence in the public debate (conferences, talks, discussion tables, courses, media or discussion forums) of experts from different professional areas of the economic world. With initiatives in social networks such as #unaeconomistapordia with which, a relevant woman in the area of ​​Economics is presented with a brief description of her area of ​​specialization or some of her most relevant works.

In May 2018 @siconmujeres was born as an initiative promoted by male economists to end the discussion round tables where male representatives are often exclusive. In the same line of avoiding expert panels with none women, or little female presence, the Office of the European Parliament in Spain launched the initiative # DondeEstánEllas, which has been signed by several entities.

4) Leadership in Universities, Scientific Academics and Prizes:

 In the study of EUA(2017) on women in leadership positions in European universities. The results show that in 47 countries with EUA members, only 12% of all rectors are female. The maximum is a third of Rectors in Sweden, Norway and Finland, and the minimum below 11% Spain, Bulgaria, Ukraine, Czec Republic, Turkey and Italy.

Women economists in Prizes: the presence of women is below the percentage of their contributions to Economics. Not only the Nobel Prize organization has shown a Male preference, but also in national prizes, as in the case of Spain, as follows:

  Prize of General Council of Economists (Consejo General de Economistas, CGE, in Spanish): In 20 Prizes for years 2001-2018 only 1 was for a female economist (5%): Josefa Fernandez Arufe, Professor of Applied Economics at the University of Valladolid (Spain) and one of the Notable Women Pioneers in Economics research and Doctoral supervision in Spain, as it appears in the article by Guisan(2018) in the journal RSES.

  Prize Queen Juan Carlos: In 20 years, 1986-2006, all Prizes for men (0% women)

   Prize Rey Jaime: In 20 years 1997-2016 all Prizes for men (0% for women)

Acccordingly to Ideas-Repec, an important international net of Economics research, theres is a percentage around 25% of Female economists (more than 14000 women out of more than 55000 total economists). Among the top 100 Spanish members of this academid net, there are 21 women economists. A list of names may be seen in Guisan(2018). Women economists at Spanish Universities currently they represent around 40% of intermediate teachers and researchers and 20% of Full Professors. Given this women activity in Economics research it seems that they should appear at least in 20% of Economic Prizes.

4) Businesswoman and executives. There is an increase of initiatives, from Associations, to increase female visibility in the business and professional firms, in engineering, architecture, art and other fields.

5) Women in political positions.

    In year 2007, Spanish socialist government approved a Law named "Organic Law of effective equality of women and men" ruling a minimun of 40% of each gender in electoral lists. Thanks to this law the percentage of Women in National and Regional Assemblies varies in Spain usually between 40 and 50, which is higher than in Italy (between 0 and 29), close to France (44 and 51), higher than in Germany (between 24 and 40) and the United Kingdom (28 and 42), as seen in EAGLE(2019).  In local political representations in Spain, the newspaper El Mundo indicates 30% majors of cities and villages 35% local councillors.

       The question in Spanish politics is not only the percentage of women in national or regional Parliaments, but a low level of internal democracy in many political parties, and excess of Male power concentration in decision making at the top of the parties. The usual voting discipline in Parliaments, following the orders of the political leader, without internal democracy in the party, indicates a low level of democracy and gives to the majority of representatives (male of female) scarce power in decision making of their votes. Women at the top of political parties are very often chosen because they are supporters of the male leaders,

4.3. Subjetive indexes of life satisfaction

     When asked to rate their general satisfaction with life on a scale from 0 to 10, people on average across the OECD gave it a 6.5. Life satisfaction is not evenly shared across the OECD however. Some countries – Greece, Hungary, Portugal and Turkey – have a relatively low level of overall life satisfaction, with average scores of 5.5 or less. At the other end of the scale, scores reach 7.5 in Denmark, Finland, Iceland, Norway and Switzerland

     Quality of life it is very much related with employment, real wage, real production per capita, quality of labor conditions but also with female participation in economic and social life, quality of Government and other variables. Generally, the educational level of population has a positive impact on the quality of many of these factors.

       Eurostat (2019) points: "When looking at low, medium and high shares of overall life satisfaction, the differences between men and women remain low. 15.3 % of male respondents stated that they have a low level of life satisfaction, in comparison to 17.0 % of females. On the other hand, 25.6 % of males and 25.2 % of females had a high rating of life satisfaction in 2018".

     OWID(2020) presents a graph, not by gender, of life satisfaction in several countries with data from Eurobarometer(2017).

 The top positions of this group of 5 European coutnries correspond to  the United Kingdom and Germany, while France is an intermediate position between both countries and the lower values are those of Italy and Spain.

More information, in the article 

Guisan, M.C., Aguayo, E. (2020). Employment and Quality of Life of Women in Spain: Evolution 1970-2020 and International Comparisons, Applied Econometrics and International Development Vol. 20-2. Abstract

Notable Spanish Women Economists: Pioneers, Doctoral Supervisors of Applied Economics and Top Researchers, 1975-2018GUISAN, Maria-Carmen Abstract

Free downloadable 

A telephon version, of the Website sidebar: