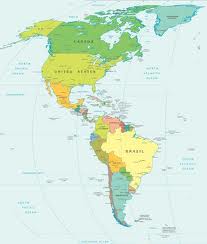
Production by sector in American Countries: 1980-2010
Economic development and real production per capita, and by sector, for the period 1980-1999 in American countries is analysed in two articles by M.C. Guisan and E.Aguayo, free downloadable at the journal Website:
Education, Industry,Tradeand Development of American Countries in 1980-99
Those articles published in the journal Applied Econometrics and International Development show an estimated average annual increase of real Value-Added per head of 1.20%.
Regarding the period 2000-2010 the average annual increase has been lower, around 0.69%, in a set of 22 American countries.
Regarding production by sector, with data calculated from World Bank Indicators, we find the following diferences, between both periods of time, in rates of annual increase of real Value-added per head, in a set of 22 American countries:
Agriculture: a light increase, from 0.80% for 1980-1999 to 0.96% for 2000-2010
Industry and Building: a decrease, from 1.62% for 1980-1999 to -0.71 for 2000-2010
Services: a light increase, from 1.07% for 1980-1999 to 1.11% for 2000-2010
Total: a decrease, from 1.20% for 1980-1999 to 0.69% for 2000-2010
Importanc of Industry and its effects on Services: We emphasize that the positive evolution of Services depends, at a great extent, on the positive evolution of industry. Industrial stagnation or decline leads to limitations in the capacity of expansion of services, and to generate negative effects due to strong external trade deficits.
Although some countries have experienced a positive evolution of industrial production per head, the average of 22 American countries has decreased. Industrial development should be improved in American countries given its positive direct and indirect effects on economic development.
Regarding industrail development, among 22 American countries in year 2010. we find, in Dollars at 2000 prices and exchange rates:
1) First group: the highest values of industrial value-added per head in Industry correspond to the USA, Canada, Trinidad and Tobago, with more than 6000 Dollars of year 2000 per capita.
2) A second group, within 2000 and 3000 Dollars of year 2000 per capita, includes: Argentina, Uruguay and Venezuela.
3) A third group within 1000 and 2000 Dollars of year 2000 per capita consiste of: Brazil, Chile, Costa Rica and México
4) Between 500 and 1000 Dollars of year 2000 per head: Colombia, Dominican Republic, Ecuador, El Salvador, Jamaica, Panama and Peru.
5) Below 500 Dollars of year 2000 per capita: Bolivia, Guatemala, Honduras, Nicaragua and Paraguay.
This set of 22 countries consists of all American countries with more than one million population in year 2010, but two countries without available data for sectoral value-added at the source of data (World Development Indicators of World Bank on line on 3rd April of 2012).
In the cases of Cuba and Haiti, without available data at the WDI search on 3rd April 2012, we find that, accordingly to other sources, Cuba would be included in the third group, with around 1038 Dollars of industrial real value-added per capita, and Haiti would be included in group 5, below 500 Dollars per capita.
Blog in Spanish on Latin America and International Development: