More maps and data about the European Union
European elections of 2019: New challenges for the European Union
There is a breach among EU bureaucracies and many social groups in several European countries. European Union would be a good club of countries if the breach would be overcome. More information, better economic and social policies are necessary.
It is important to improve the quality of economic policies in Europe. The voice of many university researchers, in fields of economy, environment, health, quality of life, and many other subjects, should be present in televisions and social means and advising political parties and institutions. This is a real challenge for Europe in the first decades of the 21st century.
Industry and economic crisis in Europe:
It is important to foster industrial development in many European countries. The commercial policies addressed to foster foreign trade with other countries should be compatible with a sound policy in order to avoid stagnation of industry in many European countries. On the other hand it is also important to favour tecnologies and policies addressed to diminish the environmental negative impact of some industries.
Switzerland is a country with very high levels of industrial development, higher than Germany and the United States, and with less contamination than those countries, is a positive example of environmental technology and policies.
The following table shows the differences of real Value-Added of Industry per capita in 5 European Union countries in comparison with Switzerland and the United States.
Table 1. Value-Added of Industry per capita (at 2010
prices) in 7 countries, for the period 1960-2010
1960
|
1980
|
2000
|
2010
|
|
France
|
1.665
|
3.167
|
3.809
|
3.321
|
Germany
|
2.114
|
4.124
|
5.218
|
5.818
|
Italy
|
1.252
|
3.086
|
3.926
|
3.130
|
Spain
|
0.551
|
1.803
|
2.707
|
2.087
|
Switzerland
|
3.490
|
5.510
|
7.540
|
8.280
|
UK
|
2.920
|
3.759
|
4.884
|
4.029
|
USA
|
2.470
|
4.234
|
6.282
|
5.584
|
Source: Elaborated by M.C. Guisan from OECD statistics. More information in Guisan(2020) in Volume 20-2 of journal AEID
We may notice a decrease of industrial real value-added per capita for the period 2000-2010 in the following countries: France, Italy, Spain and the United Kingdom. This is the consequence of failures in the European Union economic polices, without enough support to keep and increase real value-added of industry per capita in many European Union countries, which is important for reaching higher levels of economic development and employment.
Industry and CO2 emissions
It is possible to have a high level of industrial production per capita and moderate levels of CO2 emissions, such it is the case of Switzerland in comparison with other less industrialized countries with higher levels of environmental contamination. It is important international cooperation to make compatible development of industries necessary for well-being with a good quality of environment and diminution of CO2 emissions.
Comparison of CO2 per capita in countries of table 1 in comparison with other areas,
Table 2 shows the evolution of contamination by CO2 per capita (Tm) in 9 countries, together with World average and values of European Union 28.
Table 2. CO2 per capita in 7 OECD country, India, China, World and EU28 (Tm per inhabitant)
De
|
Es
|
Fr
|
It
|
UK
|
USA
|
CH
|
In
|
Cn
|
World
|
EU28
| |
1970
|
13.553
|
3.737
|
9.101
|
5.888
|
11.999
|
21.097
|
6.633
|
0.416
|
1.164
|
4.235
|
9.744
|
1975
|
13.275
|
5.049
|
8.964
|
6.385
|
11.009
|
20.633
|
6.302
|
0.443
|
1.343
|
4.276
|
9.861
|
1980
|
14.316
|
5.634
|
9.341
|
7.066
|
10.811
|
20.899
|
6.802
|
0.474
|
1.644
|
4.434
|
10.539
|
1985
|
13.717
|
5.070
|
7.108
|
6.745
|
10.150
|
19.431
|
7.008
|
0.606
|
1.813
|
4.110
|
9.749
|
1990
|
12.92
|
5.87
|
6.70
|
7.52
|
10.16
|
19.79
|
6.85
|
0.75
|
1.99
|
4.270
| |
1995
|
11.16
|
6.38
|
6.49
|
7.64
|
9.48
|
19.88
|
6.42
|
0.91
|
2.69
|
4.157
| |
2000
|
10.53
|
7.62
|
6.70
|
8.03
|
9.32
|
20.76
|
6.30
|
1.00
|
2.83
|
4.216
| |
2005
|
10.22
|
8.35
|
6.70
|
8.40
|
9.22
|
19.88
|
6.41
|
1.11
|
4.73
|
4.605
| |
2010
|
10.09
|
6.11
|
6.05
|
7.10
|
7.87
|
17.81
|
5.96
|
1.50
|
6.70
|
4.887
| |
2015
|
9.64
|
5.70
|
5.09
|
5.90
|
6.16
|
16.07
|
4.83
|
1.87
|
7.73
|
4.931
|
In year 2015 the lowest value among industrialized countries correspond to Switzerland, with a value of 4.83 slightly below World average, in spite of its highest value of industry per capita. Some countries like Spain, France, Italy and the UK have values of CO2 per capita slighty over World average. China with 7.73, Germany with 9.64 and the USA with 16.07 have very high values.
Industrial and environmental policies in Europe and in the World.
European Policies since year 2019 should increase industrial development in many EU countries, due to their positive effects on development and employment in other sectors. Those policies should be combined with environmental protection, in order to diministh the emissions of CO2 per capital.
Regarding the increase of CO2 in the World for the period 1970 to 2015, we have calculated that only a 13% was due to the increase in CO2 per capita and 87% to the increase of population.
Given that accordingly to Guisan, Aguayo and Exposito(2001) and other studies, the educational level of population is one of the most important factors in order to avoid excessive increases of population, the main conclusion is that diminution of CO2 emission, compatible with industrialization at World level, requires to increase the educational level of population and also to favor financing of environmental policies.
Real value-added per capita of industrial sectors in 6 OECD countries
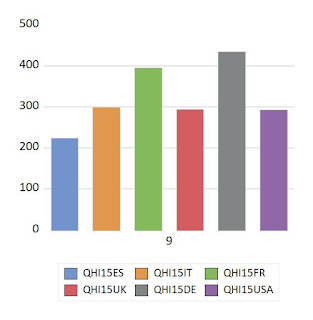
The following graphs present a comparison of Real Value-added of Industrial Production, in year 2015, expressed in Euros at constant prices of year 2010. Source: Elaborated by Guisan(2019) from OECD statistics. Data of real value-adde per capita in year 2015 is expressed as QHI15 of country i (i=es, it, fr, uk, de, usa) for Spain, Italy, France, United Kindom, Germany and the United States.
1. D05T09: Mining and quarrying [B]
|
2, D10T12: Food products, beverages and tobacco
In sector 2 the values are very alike in the 6 countries, with the highest value in France.
In sector 3, the most outstanding value corresponds to Italy, with nearly 400 Euros per capita, while the other countries have values lower than 150.
4. D16T18: Wood and paper products, and printing
The highest values of sector 4 correspond to the USA and Germany and the lowest to Spain and France.
5. D19T23: Chemical, rubber, plastics, fuel products and other non-metallic mineral products
5. D19T23: Chemical, rubber, plastics, fuel products and other non-metallic mineral products
D24T25: Basic metals and fabricated metal products, except machinery and equipment
In sector 6 the highest values correspond to Germany and Italy
7. D26T28: Machinery and equipment
7. D26T28: Machinery and equipment
8. D29T30: Transport equipment
In sector 8 the most outstanding country in the graph is Germany, with nearly 1600 Euros per capita.
9, D31T33: Furniture; other manufacturing; repair and installation of machinery and equipment
In sector 9, Germany and France present the highest values among these 6 countries.
D35T39: Electricity, gas and water supply; sewerage, waste management and remediation activities [D-E
Finally in sector 10 the most outstanding country is germany, followed by the USA.nd.
Selected readings:
Guisan, Aguayo and Exposito(2001) Economic growth and cycles: Cross-country models of Education, Industry and Fertility and International Comparisons, Applied Econometrics and International Development Vol. 1-1.
Guisan and Exposito(2018). Economic Development Problems And Crisis In The European Union, 2005-2015 Applied Econometrics and International Development Vol. 18-2.
Guisan, M.C. (2020). Industry and Development in 7 OECD Countries: France, Germany, Italy, Spain, Switzerland, UK and USA. Applied Econometrics and International Development Vol. 20-1 (forthcoming)


