Showing posts with label IDER(Development Reports). Show all posts

2025/08/30

62. IDER-25-2. Pensions and Public Spending by function as % of GDP, : France, Germany, Spain, UK, and United States 2021


      This international comparison of Public Spending by Function, shows that the sum of Total Public Spending and Retir 2, takes a value close to 50% in Germany, Spain, the United Kingdom and the United States, and a higher value (close to 60%) in France. The lower values of UK and USA in Total Public Spending it is due to that the retirement pensions have two levels (retir.1 (publica) and retir.2 (private). Total Public Spending plus Retir 2 is very similar in 4 of these 5 countries, around 50%, but in France seems to be too high. The cause of the high % of France is not due to Retirement, nor to Education, Health, and Defense but to "other public xpending". 

  Analyzing Public Spending by Function, as % of GDP, we find:

Education: The percentage of Public Education is around 4.5% in Germany, Spain and the United Kingdom, 5.38% in France and 6.11% in the United States 

Health: Around 9.2% in France, UK and USA, around 10% in Germany and 6% in Spain.

 Retirement: Retir 1 includes % of Public Spending on Retirement. Ret 2 includes % of Private Spending on Retirement in countries where Private Retirement has an important share in total income from retirement (around 50% in the UK and around 33% in the United States, accordingly to provisional estimations). 

Pensions (public and private): The sum of Retir.1 and Retir.2 is close to 12% in France, Germany and Spain, around 15$ in the United Kingdom and around 17% in the United States.

Other Public Services: 12,8% in the USA, 18% in UK, 22% in Germnay, 25% and 30% in France.

The OECD Publication Government Spending at a Glance includes more data, although with very small letter size that are very difficult for reading. We expect to include more information in a next update of this Entry.

A telephon version, of the Website sidebar: 

2024/11/06

59.IDER-24-3. International Report on Devolepmen of Ukraine, Russia and 3 Caucasian countries, 1990-2021

      Report IDER24-1 at Entry 56 of the Blog: https://euroamericanassociation.blogspot.com
    

6th November 2024.

This is the provisional report  IDER24-3. The final version of this report is scheduled to be published in Guisan(2025), Economic Development 130, available at Ideas.Repec and at the Euro.American Association of Economic Development Studies Website.

The report includes some contents from the article by Guisan(2024) in RSES 24-2.

This report compares the evolution of Ukraine with several neihbouring countries: Russian Federation and 3 Caucasian countries (Armenia, Azerbiajan and Georgia).

Our aim is to point to the great importance of avoid war and get a peaceful and sustainable solution to the conflicts in Ukraine and all the countries of the study. 

Conflicts have not contributed to foster development in  Ukraine. For the period 1990-2022  there was a diminution by 50% of its Gross Domestic Product and  there were high rates of emigration


1) Production per capita: Graph 1 show the evolution of real Gross Domestic Product per capita in the 5 countries of this report. There was a general diminution, for the period 1990-1992. In the cases of Ukraine and Russia there was a decrease until 1998.

In Ukraine there was a moderate increase for 1998-2008 and stagnation with some decrease for 2008-2022.
In Russia ther4e was a high increase for 1998-2008 and a moderate increase for 2008-2022.

Armenia and Georgia experienced a moderate increase for the period 1993-2022 but in 2008-2009 they experienced a decrease. 
Azerbaijan a moderate increase for 1994-2004, a high increase for 2004-2008 and stagnation for 2008-2022.


2) Population: For the period 1990-2022 Armenia diminished Population fron 3.6 million people to 2.8. Azerbaijan experienced an increase and evolved from 7.2 mllion people in 1990 to 10.1 in year 2022. Georgia had 4.8 million population in 1990 and 3.7 in year 2022. Ukraine experienced an strong diminution of Population from 51.9 million in 1990 to 45.1 in 2015 and 38.0 in 2022. Russia evolved from 148 million people in 1990 to 144.2 million in 2022.
        Quality of Life: Table 1 shows several indicators of economic development and quality of life in the 5 countries of this report in comparison with the average of 34 European countires and with the World averae around year 2019. 


PH19: The 1st column of table 1 shows values of real value of Tross Domestic Product per capita in year 2019, expressed in Dollars at 2017 prices and power parities. Russia had a value higher than the World average but below than the group of 34 European countries. Ukraine and Armenia were slightly below the World average, and Azerbiajan and Georgia slightly over the World average.

Tyr19; is an indicator of human capital, given by the average years os schooling attended by the adult populatio (25+ age). The 5 countries of this report has a level over the World average.

The indicators X1, X2, X4, X5 and X6, are in decimal scasle, with 0 minimum and 10 maximum.

X1: Life satisfaction: the 5 countires have values below the World average, and lower than European average.
X2: Voice of citizens, is an indicator of quality of Government. Georgia and Russia show values higher than 5, while Armenia, Azerbiajan and Ukraine have values below 5.

X4: Political stability. The lowest values correspond to Russia and Ukraine, but the 5 countries have values below 5.

X5= Peace. Ukraine, Azerbaijan and Russia had values below 4, while Georgia had a value of 4 and Armenia of 4.2.

X6= Economic Freedom. Is an indicator important for economic development. The lowest values in table 1 correspond to Ukraine and Russia, below 6, while Armenia, Azerbaijan and Georgia reached a value higher than 6. 

X8= homicides rates is an indicator of quality of social environmet in a country. It is the number of intentional homocide rates per 100 thousand people. Armenia, Azerbiajan and Georgia are below te World average, while Ukraine had a value of 6.3 close to the World average and Russia a value of 10.8.

More information:
Guisan, M.C. (2024). Industry, Development and Employment by Sector in Russia, Ukraine and 3 Caucasian Countries, 1990-2022Regional and Sectoral Economic Studies, Vol. 24-2.Abstract and pdf


2024/11/05

58. IDER-24-2. Regional Development Report of 5 European Countries: France, Germany, Italy, Spain and UK, 1960-2021


Report IDER 24.2. Regional Development in 5 European countries. Entry 57 of the
Blog: https://euroamericanassociation.blogspot.com

Page under construction in November of 2024. We expect update it before November of 2025


2024/11/04

57. IDER 24-1. Regional Development Report of BEA regions and States in the United States 1960-2022


This report is based on: 1) section 2.4 of the e-book EE12 published by our Association and available at Ideas.Repec, and on the article published by M.C. Guisan in Volume 24-2 of journal RSES
 
Chapter of EE12Maria-Carmen Guisan (ed.), 2024. "Education, Freedom, International Development and Quality of Life, 2001-2023. Economic Studies of America, Europe, Africa and Asia," ESTUDIOS ECONOMICOS EEBOOK, Euro-American Association of Economic Development, edition 1, volume 12, number ee12.

    Article of RSES 24-2A Comparison of Regional development in 5 European Countries and 8 Large Regions of the United States, 1960-2021, Maria-Carmen GUISAN  Abstract

    The article includes data of employment by sector, in the United States, in public and private jobs.


The book presents a comparison of regional development between the United States and 5 major European economics: France, Germany, Italy, Spain an the United Kingdom.

   This report IDER 24-1 presents some contents related with the United Stats and the report IDER 24-2, at Entry 57, presents some contents related with the 5 European countries.

   The report IDER 24-1 will be included in the Reports of year 2024, in AEID 24-2:
 
A telephon version, of the Website sidebar: 


2024/09/11

55. IDER 2021-2026. International Development Reports. Euro-American Association of Economic Development Studies


Updated 6th January 2026

IDER- Report 2026-1. 

64. World Development Report 2026-1: GDP per capita of 164 countries, 2019-2024 and quality of life


We analyze real production per capita and indicators of quality of life of 164 countries for the period 2019-2024, and compare yearly growth rate of real production per capita of that period with a previous study for the period 1995-2024, based in World Bank Data and other internacional sources. 
The average World rate was lower for the period 2019-2024 than for the period 1995-2024. 
We present groups of countries, accordingly to the degree of development in year 2019 and the rate of growth in 2019-2024. Among the groups 4 and 5, with real GDP per capita below 15000 Dollars at constant prices of 2021, only a 25% experienced a yearly rate of 2% or more, while 75% did not get that percentage.
Rearding quality of life, very few countries had got va value of the indicator higher than 7, which implies an average good level of welbeing, while many countries did not get an average value of 6. 


Updated 6th October 2025: 

IDER Reports of year 2025: International Development Reports of year 2025: Provisional versions are included at Entries 61 and 62 of this Blog and the final versions are scheduled to be included in new documents of the Series Economic Development at Ideas.Repec, before year 2026.

62. IDER-25-2. Pensions and Public Spending by function as % of GDP, : France, Germany, Spain, UK, and United States 2021

61. IDER-25-1. Health Expenditure per capita, public and private: Europe, the United States and other countries, year 2022

Updated  11th September of 2024: 

IDER Reports of years 2021-2024: The Euro-American Association of Economic Development Studies, has published 16 Reports in English in the series IDER (International Development Economic Reports for the period 2021-2024

The IDER reports of years 2021, 2022, 2023 and 2024, has been provisionally published in Entries of this Blogs and the final versions are scheduled to be published in year 2025 in the documents 127 to 130 of the EcoDev. More Information about new links to EcoDev at Entry 66 of this Blog.

  A summary, of the contents of the 4 documents, in Guisan(2024),  in Volume 24-2 of the journal Applied Econometrics and International Development, which is available at 

AEID-Dialnet 

         IDER 2024: Entries 57, 58, 59 and 60 of the Blog and EcoDev 130

     IDER 2023. Entries 48, 49, 50 and 56 of this Blog and EcoDev 129


                                IDER 2022. Entry 47 of this Blog and EcoDev 128


IDER 2021. Entry 46 of this Blog and EcoDev 127


Working papers 2025: International Development Economic Reports at Ideas.Repec.

Free downloadable Reports of the Series Economic Development:

  • 130 IDER-2024: Regional Development In The United States And 5 European Countries, 1960-2021 And Other International Reports
    by GUISAN, Maria-Carmen
  • 129 IDER-2023: Development Of 8 Latin American Countries For 1950-2021 And Report On Health Resources In Europe For 1996-2019
    by GUISAN, Maria-Carmen
  • 128 IDER 2022: Internacional Reports On CO2 Emissions, Education, Industry And Development, 1970-2020
    by GUISAN, Maria-Carmen
  • 127 IDER-2021: International Reports Of India, China, Oecd, Africa, Europe And World Development For 1995-2019
    by GUISAN, Maria-Carmen

Reports on economic development of Spain, Latin America and other areas in Spanish.

Besides this series IDER in English, our Euro-American Association of Economic Development Studies, also has published, for the period 2001-2024, the series IDEI and IDEE:
  8 Reports in Spanish in the Series IDEI (Informes de Desarrollo Económico Internacional)with special focus on Latin America and OCDE, with initial contents at our Blog Internacional in Spanish and final versions in EcoDev 131.

 8 Reports in Spanish in the series IDEE (Informes de Desarrollo Económico de España), with initial versions at our Blog of Spanish Economy and final versions in EcoDev132.
New links to IDER and other working papers EcoDev at Entry 66 of this Blog


2023/03/13

50. IDER 2023-3. Latin America, 1950-2021: International Report on Mexico, Colombia, Peru and comparison with China.


      Graph 3 presents a comparison of 3 Latin American countries (México, Colombia and Peru) with China for the period 1950-2023.

      We may notice that real Gross Domestic Product (GDP) per capita was much higher in  these Latin American countries than in China for the period 1950-1980. After 1980 the increase of industrialization in China started to diminish the gap of GDP per capita with some Latin American countries and in the period 2015-2021 surpassed the values of Peru and Colombia and almost reached the value of Mexico in year 2021.

      The graph shows an important increase of real GDP per capita in Mexico for the period 1950-1980 and a lower increase for 1980-2021. An interesting article by Moreno-Brid and Sanchez(2022), published in the journal RSES Vol. 22-2.  highlights the positive impact of the industrialization policies of the period 1950-1980. 

    More information at the Entries 48 and 49 of this Blog and also at the following article in English, free downloadable at Ideas.Repec and Dialnet and in our Blog on Latin America and International Development in Spanish:
   

Blog in Spanish  on Latin America and International Development:

49. IDER 2023-2. Latin America, 1950-2021: International Report on Brazil and Chile and Comparison with China and Europe.


     In Graph 2 of the study by Guisan(2023) we present the evolution of 2 Latin American countries: Brazil and Chile, with China and with 2 European countries (France and Spain).

   We may notice that Chile had a value of real Gross Domestic Product (GDP) per capita close to Spain for the period 1955-1960 and that Brazil had a value close to Chile for the period 1975-1990.

   Thanks to a higher level of industrialization, and other factors, Spain experienced a high increase of real GDP per inhabitant for the periods 1960-1975, 1985-1991, 1992.2007 with decrease and recovery for 2007-2021, and Chile for the period 1990-2018. China also experienced an important increase of industrialization and development since year 1990. reaching and surpassing Brazil by the period 2015-2021. 

     Accordingly to this study the level of industrialization has shown low incrase in many Latin American countries, while China and the World average have experienced a higher increase. While in 1950 the average of Manufacturing production per capta in Latin America was higher than the World average, in year 2000 both values were very alike and in year 2021 the World average was higher than the average of 8 Latin American countries.

    More information at the Entries 48 and 50 of this Blog and at the following article in English, free downloadable at Ideas.Repec and at Dialnet, and in our Blog on Latin America and Intrnational Development in Spanish:


Blog in Spanish on Latin America and International Development:


48. IDER 2023-1. Latin America, 1950-2021: International Report on Argentina, Chile, Cuba and Venezuela.


Guisan, Maria-Carmen (2023). Economic Development in 8 Latin American Countries: Argentina, Brazil, Chile, Colombia, Cuba, Mexico, Peru and Venezuela. Applied Econometrics and Interntional Development Vol. 23-1.


This study is free downloadable at Ideas.Repec and Dialnet, and also by clicking on the name of the journal.

Graph 1 of the study by Guisan(2023) shows that Argentina, Venezuela and Mexico were the top 3 countries out of the 8 countries of this study in real Production per inhabitant in year 1950. In year 2021 the top 3 were Chile, Argentina and Mexico.

In the next entries of this Blog we include other graphs and more information of this study.

The indicator of Manufacturing per capita, life satisfaction, quality of government, freedom and other ones, in Argentina and Chile are higher than in Cuba and Venezuela.

Blog in Spanish on Latin America and International Development:

2022/03/01

47. IDER-22-1 to 22-4. CO2 Total Emissions in the World 1970-2015 and other international development reports

Source: Guisan and Exposito(2020). Applied Econometrics and International Development, Vol.20-2 


    IDER 22. International Development Reports of year 2022

Final version published in Guisán(2025b), EcoDev 128. Initial version published in Entry 47 of https://euroamericanassociation.blogspot.com

IDER 22-1.CO2 Total Emissions in the World 1970-2015

It includes some contents  of Total CO2 Emissions, Population and CO2 per capita,  presented in the articles:  

Guisan(2020) in AEID 20-1.

Guisan and Exposito (2020), AEID 20-1.  

The article by Guisan and Exposito(2020) shows that 87% of increase in Total World CO2 Emissions, for the period 1970-2015, was due to Population Growth while the World average of CO2 Emissions per capita explains only 13% of the total increase. Besides it is important to have into account the effects of Wild Fires, because excluding the effect of those fires, the average per capita diminished from 4.23 to 4.0 Tm per inhabitant.

 The empirical evidence shows that it is important to foster international cooperation for increase financial help to education in low income countries, because it is the best way to get sustainable development with moderation of high rates of population growth and improvement of economic development, health assistance and poverty eradication.

Under the Hypothesis of Population growth for the period 2025-2030, at the article by Guisan and Exposito are the following ones: 1) to reach 8.249 Bn people (the most moderated), 2) to reach 8733 millions (the highest of the 3 hypotheses of the article), there are important differences in development and environmental pollution. Under the hypotheses of increase of education and moderation of average fertility rates, there are more possibilities for poverty eradication and increase of real income per capita, health services and quality of life, as well as a moderation in the increase of Total CO2 and and other environmental problems.

The main industrialized countries of the European Union have diminished, not only in per capita terms, but also CO2 Total Emissions, given is moderate rate of population growth. Total Emissions of CO2 have diminished by 475 million Tms in a group of 6 industrialized European Countries (France, Germany, Italy, Switzerland, United Kingdom and Spain), for the period 1970-2015.

More information

EPA. United States Environement Protection. Agency. Gobal Greenhouse Gas Emissions Data.

IDER 22-2. Industrial Production by Sector in France, Germany, Spain and the United States, in year 2015.

A telephon version, of the Website sidebar: 

2022/01/18

46. IDER 21-1 to 21-4. Education, Production and Quality of Life in 164 countries, 1995-2019 and other international development seports


     IDER are International Development Economic Reports: Reports published by the Euro-American Association of Economic Development Studies since year 2021. Provisional versions for each year are published in this Blog and afterwards published in the working paper series EcoDev of the Research Team of Econometrics of the Faculty of Economics of the university of Santiago de Compostela (Spain). 

Update of 30th July of 2026

IDER reports of years 2021 to 2024 have been published in EcoDev 127 to 130.  See new links at Entry 66 of this Blog.


Initial version 25-12-2022. Updated 11th September 2024.

IDER reports of year 2021 is scheduled to be published in EcoDev 127 in year 2025 

IDER

INTERNATIONAL DEVELOPMENT REPORTS year 2021

2021-4

Wages, Productivity and Quality of Life in France, Germany, Spain and the United States,  1960-2019 . Related article in Guisan(2021) in RSES (4)

2021-3

Industry, Education and Development in 53 African Countries, 1995-2019  (3)

2021-1

A Comparison of India, China and OECD Countries for 1950-2020  (2)

2021-1

Educarion and Development of 164 Countries for 1995-2019

The final versions of IDER reports of year 2021 are scheduled to be published in Guisan(2025 c) EcoDev 127 at Ideas.Repec. See Note of 30th July of 2026, at the end of this Entry, or Entry 66 of this Blog, with new links of year 2026 at SSRN and Minerva-USC.


Related articles in AEID and RSES:


(1) World Development For 1995-2020: Econometric Relationships Of Human Capital, Development, Quality Of Government And Life Satisfaction In 164 Countries, Guisan, M.C   Abstract and article in AEID 21-1

(2) Employment by Sector and Development in India for 1950-2020 and International Compa-risons with China and OECD Countries, Guisan, M.C.Abstract and article in AEID 21-1.


(3) Industry, Education, Development and Quality Of Life In 53 African Countries, 1995-2020, Guisan, M.C., Exposito, P.  Abstract


(4) Spanish and European Report 2021: Wages, Productivity, Quality of Public Sector and Citizens Satisfaction, Guisan M.C. (Abstract and article in English) (Article in Spanish)


 Initial versions of IDER 21-1 to 21-4 (year 2021)


             IDER 2021-1: World Development 1995-2019

 Evolution in 24 years:  Real production per capita increase in 6249 Dollars (at 2017 prices) in a period of 24 years (from 1995 to 2019), what implies an average of 260 Euros per year, but in the 2 groups of poorest countries the increase was very low with only 20 Euros per year in group 1). 


      1) Education and Development: Usually Education is the variable with the highest impact on economic development and quaality of life. The indicator Tyr10 is "Total years of schooling of adult population (+25 years old) in year 2010. The value varied between a low average of 3.38 years of Schooling in group 1 (lowest level of economic development)  to 11,66 in group 9 (highest level of economic development). World average was 8.09.


      2) Average Fertility rate: As seen in the econometric model of Guisan, Aguayo and Exposito (2021) (journal AEID Vol. 1-1), there is an important impact of Education in the moderation of average fertility rates. In table 1 we may notice that countries with the lowest levels of Schooling have high average Fertility rates (4.82 children per woman in group 1) while countries with high educational levels have moderate average Fertility rates (1.53 children per women in group 9). 


        3) Indicators of Quality of Life in a scale 0 (minimum) to 10 (maximum). 

Indicator X1=Happiness varies from an average of 4.27 in group 1 to 7.07 in group 9, usually increasing with real income, health care access, working conditions, and other variables related with socio-economic development. 

Indicator X2=Government Quality (calculated in the scale 0 to 10 from the World Bank data of Voice of citizens) varies from 3.12 in group 1 to 7.07 in grourp 9, usually increasin with socio-economic development.

Indicators X3 and X4 (X3=degree of conflict, X4=degree of peace). The average value of X3 varies between 6.00 in group 1 to 3.70, with many types of conflicts usually decreasing with socio-economic development. The average value of X4 varies between 4.00 in group 1 to 6.30 in group 9, usually increasing with socio-economic development. 


Indicator XM is the mean of the indicators X1, X2 and X4. The average value varies between 3.79 in group 1 to 7.20 in group 9, usually increasing with socio-economic development. 


Other contents of the Development Report: The main objetive of this report is to foster international cooperation in order to increase Schooling, Investment, Production per head and Quality of Life in the World, particularly in countries with the lowest levels.


We highlight the following table from the Report published in  AEID 2021 by Guisan, M.C., which is free downloadable by clicking on "Abstract":


 Source: Guisan , M.C. (2021). World Development For 1995-2020: Econometric Relationships of Human Capital, Development, Quality Of Government and Life Satisfaction In 164 Countries, Guisan, M.C   Abstract

                  We may notice a positve evolution of Production per head,  in the 9 groups of countries of the table for the period 1995-2019, but with great differences among the lowest and the highest values, both in 1995 and 2019. Countries of groups 1 to 5 were below World average in year 2019. 

            Countries with the highest levels of Education, with average years of School Atteinment of adult population higher than 10 years, are over the World average of Production per capita and also have good average values in other indicators: Between 6.07 and 7.07  average points for  "Happiness"; average between 5.94 and 8.24 points in the indicator of Quality of Government (given by Voice of Citizens), between 5.47 and 6.30 for the indicator of Peace, and between 5.83 and 7.20 as average values of XM (being XM the meand of the indicators X1 (Happiness), X2 (Government Quality) and X4 (Peace).

IDER 21-2.

The following graphs show the increase of Production per head and Productivity per worker in India, China and OECD countries, for the period 1951-2000. 
        (Increase in Dollars at 1990 prices and purchasing parities)
       Elaborated by Guisan((2021) in AEID (2021) with data from Maddison and World Bank.

     The report and the related article published in AEID 21-1 expalin the important impact of Education and Industry on the evolution of Production per head and Productivity per workder.

IDER 21.3. Africa

The average production per capita in 35 African countries was below World average for the period 1995-2019. The average real value of Gross Domestic Product per capita in Africa evolved  from 3849 in year 1995 to 6086 in 2019, while World average evolved from 9886 in 1995 to 16135 in year 2019. 

The average years of schooling in Africa (4.78 years of schooling of adult population) was clearly below the World average (8.09) in year 2010). The empirical evidence show the positive impact that Education usually has in the moderation of excessively high fertility rates and in the increase of savings per capita, investment per capita and industrial production per capita, development and quality of life.

The comparison of Africa average with World average shows, in year 2019, a Fertility rate of 4.10 in Africa and 2.40 in the World. The indicators of quality of life X1(Life satisfaction), X2 (Quality of Government: Voice of Citizens) and X4 (Peace) of Africa were below World averages. 
X1= 4.28 in Africa and 5.35 in the World
X2=3.50 in Africa and 5.0 in the World
X4=4.37 in Africa and 4.80 in the World

The comparison of real value-added per capita by sector, accordingly to the World Bank data, shows the following differences in year 2017:
QHA= Agriculture and Fishing: 592 in Africa, 766 in the World
QHI= Industry and Building: 1211 in Africa, 4771 in the World
QHS= Services: 2411 in Africa and 12149 in the World

Africal countries with the highest levels of QHI are usually those with with the highest levels of QHS and real GDP per capita.
Education contributes to favor savings and credits per capita and to increase industrial production per capita.

IDER 21-4. Wages, Productivity and Industry in France, Germany, Spain and the United States. International Report 1960-2019.

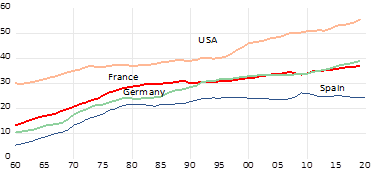
This graph shos the evolution of average real wages, expressed in thousand Dollars per worker at 2000 prices and exchange rates. Wages are calculated as the ratio between Compensation of Employes and number of Employees, and thus it includes social costs. that firms and worker pay, linked to the wages.

   Graph: Real average wage in 4 countries for 1960-2019
     (Dollars per employee at 2000 prices and exchange rates=

Source: Elaborated by Guisan from OECD statistics

    Graph: Real Mean Productivity of labour (PM) in 4 countries
     for 1960-2019 (Dollars per employee at 2000 prices and parities)

       Source: Elaborated by M.C. Guisan(2021) from OECD statistics


Spain has the lowest level of average real wage, in this group of 4 countries, because it has also the lowest level in productivity per worker. It does not imply that the Spanish workers are not efficient, but that the country has the lowest level of industrial production per inhabitant. The empirical evidence of international studies confirm the Kaldor´s views that the increase of industrial production and productivity has positive effects on the productivity of other sectors and on real Gross Domestic Product per capita. 
Spain is also the country of the group with lower resources devoted to Rsearch and Development, in this group.
The United States has kept, for all the period 1960-2020. a great advantage in comparison with these 3 European countries regarding real wages, producitiviy and development.

Note of 30th July of 2026
New Links to IDER21, 22, 23 and 24 in the series Economic Developmet of year 2025, at Minerva-USC and ISSN since August of 2026. More information at Entry 66 of this Blog.

Besides IDER reports and other working papers of the series EcoDev have been accesible thorugh Ideas-Repec (Abstracts and pdfs). Unfortunately since 4th May of 2026 only Abstracts are available at Ideas.Repec, because the link that communicate the hosting of pdfs at our university has been broken due to informatic changes. Pdfs are going to be available through Minerva and SSRN and we will try to recover the connection with Ideas.Repec.


 A telephon version, of the Website sidebar: