Showing posts with label Entries 11 to 20. Show all posts

2012/08/21

20. Industrial Production and economic crisis in the European Union, year 2012

    Note: Blog of the Euro-American Association of Economic Development Studies

Graph of IPI in EU15 2012: This graph shows the variation of IPI (Industrial Production Index) of 15 European Union countries (EU15) during the period 2005-2012. The country codes are as follows: Belgium (Be), Denmark (dk), Germany (Dk), Ireland (Ie), Greece (Gr), Spain (Es), France (Fr), Italy (It), Luxembourg (Lu), Netherlands (Nl), Austria (At), Portugal (Pt), Finland (Fi), Sweden (Se), United Kingdom (Uk).
We notice that in 9 countries there has been a decrease of IPI (in 6 cases between 10% and 20%, and a lower decrease in the other 3 cases), while in only 6 cases there has been an increase (in 3 cases between 10% and 20%, with the remaining 3 countries with lower increase).
Austria has been the country with the highest increase and Greece the country with the higher decrease.
In EU27 IPI stays around 99% in the first semester of 2012 in comparison with the value of 100 in the base year 2005, what means a clear stagnation of industrial production.
Failure of EU industrial policy: In general we notice a failure of EU industrial policy, with a lack of support to industrial development that is in the center of the economic crisis of many European countries.

2012/04/02

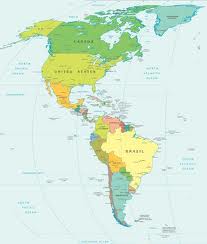
19. Economic Development, Industry and Production by Sector in American Countries, 1980-2010


Production by sector in American Countries: 1980-2010

Economic development and real production per capita, and by sector, for the period 1980-1999 in American countries is analysed in two articles by M.C. Guisan and E.Aguayo, free downloadable at the journal Website:

Education, Industry,Tradeand Development of American Countries in 1980-99
Those articles published in the journal Applied Econometrics and International Development show an estimated average annual increase of real Value-Added per head of 1.20%.

Regarding the period 2000-2010 the average annual increase has been lower, around 0.69%, in a set of 22 American countries.

Regarding production by sector, with data calculated from World Bank Indicators, we find the following diferences, between both periods of time,  in rates of annual increase of real Value-added per head, in a set of 22 American countries:

Agriculture: a light increase, from 0.80% for 1980-1999 to 0.96% for 2000-2010
 Industry and Building: a decrease, from 1.62% for 1980-1999 to -0.71 for 2000-2010
 Services: a light increase, from 1.07% for 1980-1999 to 1.11% for 2000-2010
Total: a decrease, from 1.20% for 1980-1999 to 0.69% for 2000-2010

Importanc of Industry and its effects on Services: We  emphasize that the positive evolution of Services depends, at a great extent, on the positive evolution of industry. Industrial stagnation or decline leads to limitations in the capacity of expansion of services, and to generate negative effects due to strong external trade deficits.

    Although some countries have experienced a positive evolution of industrial production per head, the average of 22 American countries has decreased. Industrial development should be improved in American countries given its positive direct and indirect effects on economic development. 

   Regarding industrail development, among 22 American countries in year 2010. we find, in Dollars at 2000 prices and exchange rates:

1)  First group: the highest values of industrial value-added per head in Industry correspond to the USA, Canada, Trinidad and Tobago, with more than 6000 Dollars of year 2000 per capita.
2) A second group, within 2000 and 3000 Dollars of year 2000 per capita, includes: Argentina, Uruguay and Venezuela.
3) A third group within 1000 and 2000 Dollars  of year 2000 per capita consiste of: Brazil, Chile, Costa Rica and México
4) Between 500 and 1000 Dollars of year 2000 per head: Colombia, Dominican Republic, Ecuador, El Salvador, Jamaica, Panama and Peru.
5) Below 500 Dollars of year 2000 per capita: Bolivia, Guatemala, Honduras, Nicaragua and Paraguay.

This set of 22 countries consists of all American countries with more than one million population in year 2010, but two countries without available data for sectoral value-added at the source of data (World Development Indicators of World Bank on line on 3rd April of 2012).

In the cases of Cuba and Haiti, without available data at the WDI search on 3rd April 2012, we find that, accordingly to other sources, Cuba would be included in the third group, with around 1038 Dollars of industrial real value-added per capita, and Haiti would be included in group 5, below 500 Dollars per capita.

Blog in Spanish on Latin America and International Development:

2011/08/23

18. Impact of Trade Deficit on crisis and drop of Industrial production in the USA and 5 European major countries: France, Germany Italy, Spain and UK

Graph 1. Real Value-Added of Industry per capita in France, Germany, Italy, Spain, the United Kingdom and the United States. Source: Elaborated by Guisan(2011) from OECD statistics.

Graph 2. Trade Balance of EU27 and industrial real value-added of EU5. Source: Elaborated by Guisan(2011) from Eurostat Statistics. Left axis for Extra-EU27 Trade Balance. Right axis for Value-Added of Industry. Source: Elaborated by Guisan(2011) from Eurostat and OECD statistics.

Industrial production in the Europea Union for 2000-2010: The lack of enough european policies of support to industrial production have led to decreasing real Value-Added of industry and increasing trade deficits in the balance of goods of EU27, as it is shown in the graph 2 above.

The impact of wrong policies on industrail development of many European countries has been very strong for the period 2008-2010, and some politicians and citizens are showing concern and disagreement with the EU policies in this regard. Diminution of industrial production implies negative consequences for the European Union such as lower production in other sectors, more unemployment and increse of international debt.

Graph 1 shows the evolution of real Value-Added of industry per capita in the 5 major European Union countries (those with highest levels of Gross Domestic Product and Population) for the period 1985-2010.

European Union problems: The European Union documents usually assumes that "The EU´s external trade policiy contributes to Europe´s competitiveness in foreign markets" and includes declaration as the following one: "The EU has a common trade policy whereby the European Commission negotiates trade agreements and represents the EU´s interest on behalf of its 27 Member States. The European Commission consults Member States through an advisory committee which discusses the full range of trade policy issues affecting the Community including multilateral, bilateral and unilateral instruments". In spite of these declarations many people think that policies for industrial development and less deficit should be addressed.


It is clear that the European public opinion and many leaders do not agree with those trade policies that have led to increase indebtness and diminution of industrial development. Some reactions are active in France and the United Kingdom, and surely in other countries, which may be of interest to recover industrial development and favor a balanced trade of the European Union with extra-UE partners, or at least to diminish the trade deficit.

Trade deficit in EU27: In fact in year 2009 the trade balance was negative in 17 countries, positive in 10, and negative for EU27 as a whole.

Countries with positive trade balance of goods in 2009: Belgium, Czec Rep., Denmark, Finland, Germany, Hungary, Ireland, Netherlands, Slovakia and Sweden.

Countries with negative trade balance of goods in 2009: Austria, Bulgaria, Cyprus, Estonia, France, Greece, Italy, Latvia, Lithuania, Luxembourg, Malta, Portugal, Romania, Slovakia, Spain and the United Kingdom.

The most positive balance in Euros per capita, more than 1000 € in year 2009, corresponded to Belgium (1194), Denmark (1465), Germany (1644), Ireland (8568), Netherlands (2380).

The most negative balance in Euros per capita, less than -1000 € in year 2009, corresponded to Cyprus (-5918), Greece (-2531), Luxembourg (-4940), Malta (-3283), Portugal (-1787), Spain (-1081) and the United Kingdom (-1513).

Crisis and solutions: The European Union should show concern about high deficits in extra-EU trade, particularly if those deficits lead to diminution of industrial production per capita, particular if dismantling EU´s industry is not accompanied by an increase in the International Investment Position or in other variables that can guarantee sustained development. European Economic Policies should be adressed to diminish deficit in extra-EU balance for the EU as a whole and to make sustainable the intra-EU imbalances among countries. Sustainability presents to options: 1) all EU countries would promote industrial development to a degree enough to guarantee real convergence with the most advanced economies. 2) European Unions would guarantee flows of credit from EU countries with superavit to EU countries with deficit, like among different regions of a single country. European Parliamente and Commission may choose a mix of both options, but they should offer to all EU countries opportunities for sustainable development.


Selected newspaper article on industrial problems in EU countries:

Telegraph: Where will Britaint´s manufacturing revival come from?, by Louisa Peacok, 2nd June 2011.

2011/05/13

17 Crisis, Development, Voice of Good Economists in Greece, Portugal and Spain, and comparison with other OECD countries. Euro-American Association Development Report 2011.

Source: Guisan(2011) based on OECD National Accounts Statistics


Greece: beautiful Egina


The graph shows real value-added per capital in industrial sectors. One of the main causes of economic crisis in Greece, Portugal and Spain is their low level of industrial development in comparison with more advanced OECD countries. Countries with low levels of industrial production per head very often experience twin deficits: 1) unbalanced foreign trade, with more imports than exports, and 2) government deficit because, as a result of the low level of industrialization, income from taxes and other sources is below the amount needed to provide satisfactory levels of public services. The attemps to foster production in building and services without a proper development of industry per capita, like it has happened in Spain and other countries for the period 1995-2007, is usually unsustainable and lead to economic crisis as it has happened in Spain for the period 2008-2010.

There are good economists in those countries but unfortuantely policy makers usually do not listen to their good advice. People do not expend too much, but instead most people in those countries work hard and expend little. It is not fair to throw blame on citizens for the causes of the crisis when the main cause is the lack of good economic policies, at national and European Union level, in order to foster industrial development.

Here we will include references to interesting articles and Websites where good economists give useful advice to improve development and avoid economic crises in those countries.


LISTEN TO THE VOICE OF GOOD ECONOMISTS AND GET OUT OF THE CRISIS


Recommended readings about crisis and development in Greece:
"Development is the only solution. Seventeen Proposals for a New Development Stategy", Azariadis, C.(Washington Universitry, MO, USA), Ioannides, Y. (Tufts University,MD,USA), Pissarides, A. (LSE, London UK) (2010).
"Is there a strategy that can free Greece from the grip of today´s unprecedental economic and social crisis and place her on a path of sustainable development and solid prosperity? The signers of this article believe that the answer is yes if the country is willing to go beyond the measures of fiscal austerity and market reform advised by the EU-ECB.IMF "troika". We predict that market reforms will not succeed unles they are supplemented by powerful pro-growth policies. The real choice of Greece is not between solvency and default or between reform and stagnation; it is between prosperity and underdevelopment". See full article

Website on Greek Development: http://greekeconomistsforreform.com/

Recommended readings about the positive impact of manufacturing on development, through intersectoral relationships in Europe, America and other areas:

Guisan, M.C.(2006).”Industry, Foreign Trade and Development: Econometric Models of Europe and North America, 1965-2003International Journal of Applied Econometrics and International Development, Vol.3-1. Article free on line: click on "Download"" at: http://ideas.repec.org/a/eaa/ijaeqs/v3y2006i1_1.html

Guisan, M.C.(2007).”Industry, Foreign Trade and Development: Econometric Models of Africa, Asia and Latin America, 1965-2003” International Journal of Applied Econometrics and International Development, Vol.4-1. Article free on line: click on the Abstrac page and then on "Download"" at the Web site of Journal IJAEQS.http://ideas.repec.org/s/eaa/ijaeqs.html

GUISAN, M.C. and AGUAYO, E. (2007). "Production by Sector in The European Union: Analysis of France, Germany, Italy, Spain, Poland nnd The United Kingdom, 2000-2005". Regional and Sectoral Economic Studies, Volume 7-1. On line at: http://ideas.repec.org/a/eaa/eerese/v7y2007i7_3.html


Other interesting articles at our journals AEID and RSES

2011/02/21

16. Euro-American Association of Economic Development: Comments on poverty, world development and the book by P. Collier "The poverty bottom billion"

Table of Poverty in the World: Source Guisan and Exposito (2010) elaborated from World Bank Indicators. Pubished in journal EEDI/ESID (english version will be announced here).

Interesting book by Paul Collier(2007): "The Bottom Billion: Why the Poorest Countries are Failing and What Can Be Done About It" More information at: Look inside the book at Amazon
The autor: Paul Collier is a distinguish researchers in economic development. Professor of Economics, Oxford University Economics Department and Director of Centre for the Study of African Economies. More information at Oxford University

Links to other comments on the book:How the bottom billion are trapped? By Martin Wolf, Financial Times, May 13 2007.

Terry OBrien "The Bottom Billion: Why the poorest countries are failing and what can be done about it: Some insights for the Pacific?" Australian document.

Our comments on the poverty billion and what can be done:
Accordingly to World Bank data and our estimations, extreme poverty (less than 2 dollars a day per person) has evolved from 46.81% of World popublation in year 2000 to 41.70% in year 2005. It is a huge percentage of people, and surely more effective policies should help to alliviate this problem. We share the aim to help the poor to have opportunities for a better life, and accordingly to the experience of selected international development studies we insist on the convenience to improve education and labor opportunities in those countries.
In Collier’s view some countries have fallen into one or often more of four traps, and resolving their problems will require novel ways of addressing those traps.
Trap 1: Conflict.
Trap 2: Mismanaged dependency on natural resources
Trap 3: Weak quality of governance in small countries
Trap 4. Difficulties for access to large markets (for example lanlocked countries without friendly
neighbours)
Other problems are often present in the poorest countries, such as earthquakes, unhealthy climate, river floods and other ones.
Accordingly to international econometric models and other studies, improvement of the educational level of population is a great advantage to solve many of these problems, having into account that usually education has a positive role to foster peace and cooperation, to improve quality of government, to prevent nature disasters, and to get a better management of natural resources and industrialization.
Some interesting articles in this regard are, among others, the following ones published by our Association in the journal Applied Econometrics and International Development, free available by clicking on "download" at the Abstract page:

2010/11/14

15. Employment in Social Services in OECD countries: Europe, United States and Japan. Euro-American Association Report 2010.


 Countries: Mexico, Spain, Italy, France, Germany, UK, USA, Japan, Finland and Switzerland

This graph shows the number of employed persons per 1000 inhabitants in services related with Education, Health, Public Administration and Other Social and Personal Services, in 10 OECD countries in year 2005:

We may notice that  in a first stage, with the lowest values, are Mexico, Spain and Italy. A second stage correspond to France and Germany, while a third stage correspond to the United Kingdom, the United States, Finland and Switzerland which are in a higher level. Finally Japan shows the top position of this group of 10 OECD countries.
The number of employed persons varies from less than 100 per thousand people in Mexico to more than 200 in Japan, with an intremediate position around 150 in the UK, the USA, Finland and Switzerland.
It is important to notice that a high number of people in social services, and the quality of their work, is of uppermost importance for social wellbeing and development.

2010/06/20

14. European Universities: Reactions to abuses and misuses of bibliometrics and bureaucracy in evaluation of researchers

Source: Euro-American Association of Economic Development Studies. Report 2010.


Some important challenges of European Union are to foster reasearch on development in its space and also improve international cooperation for research and development

Our main conclusion in this regard is that the European Union should improve channels of communication with researchers interested in these questions, instead of stress them with an overwhelming and unnecessary bureaucratic rules.

This graph presents a comparison of expenditure in Research and Development in several European Countries (Germany: De, France: Fr, Finland: Fi and Spain: Es) in comparison with the United States: USA, and Japan: Jp. France values represent the average of former UE15 countries, with the United Kingdom very alike and Italy below although higher than Spain.
In many European countries, university researchers not only receive less financial support for research but also, in several countries, experience more difficulties than in the USA in research evaluations due to abuses and misuses of bibliometric criteria for evaluaton. Bibliometrics may be used, among other criteria, for international comparisons of countries and even in some degree, of course together with other suplementary criteria, at university level. As stated by Anthony Van Kaan, Director of the Centre for Science and Technology Studies at Leiden University (Netherlands): "If there is one thing that every bibliometrician agrees, it is that you should never use the journal impact factor to evaluate research performance for an article or for an individual - that is a mortal sin".
See Nature nº 465 of June 2010 at:
Unfortunately in some countries bureaucrats of Evalution Committes are not so wise as Anthony Van Kaan expects, and there are abuses and misuses of bibliometrics.
We will include here some important reactions that have arisen in Europe against the abuses and misuses of bibliometric rigidity in evaluations. To avoid those unfair abuses and misuses is goods news not only for European researchers but also for other countries where university researhcers are also suffering this kind of abuses. There are also other beneficial effects of avoiding unfair practices in European bureaucracies: a good policy of support to researchers in Economics, Social Sciences and other areas will have a clear positive effect on European cooperation to developing countries.
Problems and perspectives of support to researchers in Europe:
Problem 1) Only a few European countries provide enough financial support without unnecesary bureaucratic barriers to researchers. It is important to foster activities of tearchers unions and associations in countries with very low level of support to researchers, like Spain, in order to achieve higher levels of support from Government and public institutions. Improvements requiere not only to increase financial support but also diminish bureaucratic barriers with obscure and unfair rules which are time-consuming and do not help to many good researchers. A net of European researchers associations good be a positive support in this regard, accordingly to the positive experience of the National Tearchers Association and other organizations in the United States.
Problem 2) The Commission of the European Union has been until now (June of 2010) too much bureacratic and less effective to foster EU research. EU Commision suffers in many regards "euro-sclerosis" a kind of bureaucratic illness, which is a barrier that does not help to foster university research in many fields. Although in technology and some experimental sciences there are some fortunate teams which have reached support form EU a serious criticism is that EU rarely supports European communication in socio-economics and other ares of great importance not only for European development but also to improve international cooperation with developing countries. Universities and academic Associations do not receive almost any support for multilingual publications in the most spoken languages of Europe. It is a great news to know that some universities have signed in year 2009 an agreement to foster an European University Press addressed to increase readership in several countries of some of the main publications of European universities. It should be interesting to see if the EU authorities support this and other interesting initiatives from private or public organizations in this regard.
Reactions against this illness: As seen in ForoUnives2010 (entry in English) more than 13000 European researchers have signed the Manifesto "Trust in Researchers" in order to request a diminution of the overwhelming amount of bureaucratic and time-consuming barriers to European funding that researchers find every year. For the moment we have got a positive promise from European Union Commission. Now we are waiting for real changes in this regards.
Many researchers think that it is good news the promise of alleviate this bureaucratic barriers by EU Commissiariat of Science as seen in Nature of 15th June of 2010:
For the moment it seems good news for natural and experimental sciences. We will be glad to report in the future if new EU policies also increase support to Social Sciencies and Humanities.

Problem 3) Abuse and misuse of bibliometrics for research evaluation in several EU countries. We report here the situation in several countries against the unfair bureaucratic movement addressed to impose bibliometrics as a mechanic system of research evaluation
Spain: Thousands of researchers have signed a Manifesto in Spain against the unfair procedures of the Ministry of Education during the period 1989-2010, and particularly since 1994, when they imposed bibliometric misuse on Economics and Other Social Sciences, and other unfair procedures on the individual evaluation of researchers in the "six-years evaluation" of activity known as "Sexenios". The problem is not yet solved by the Ministry of Education, in spite of support to several pleas of the Manifesto by the Senate of Spain, Commission of University Rectors and other institutions, Associations, Trade Unions and other social forces for the period 1994-2010.
Updated 14th November 2010: A good news is that a Committee of Univesity Rectors related with Economics and Business studies (CR8) has reached an agreement by unanimity with the Committe of Deans of Spanishs Faculties of Economics and Business to present to the Ministry of Education, Angel Gabilondo, a proposal of new criteria for evaluation of researchers more realistic and which is expected to give more support to good researchers. We are waiting for new more fair rules from the Ministry. We expect to inform here if in the future we get good news in this regard. More information in Spanish at ForoUnives 2010.

UK: It is remarkable the positive reaction of the Parliament of Great Britain in order to avoid bibliometric abuses in the Research Assessment Exercices as seen in the Tenth Report of year 2004 by the Select Committe on Science and Tecnololgy. Regarding the right criticisms against bibliometrics abuses in the Social Sciences it is interesting to mention the positive impact of articles by Claire Donovan, as those published in academic journals and in the Times Higher Education (THE).
Germany:
France
Other European countries:
This entry will be soon updated.

Links to other Website with interesting information on abuse and misuse of bibliometrics:
August 12, 2008. "The Use And Misuse Of Bibliometric Indices In Evaluating Scholarly Performance" http://zzzoot.blogspot.com/2008/08/use-and-misuse-of-bibliometric-indices.html

2010/03/02

13. Comments on Krugman´s views of Spanish economy: Salaries are not to blame and should not diminish. Productivity should increase.

Source: Elaboration by Guisan(2009), from OECD National Accounts,  in EEDI Report Vol. 9-2.


This graph shows the evolution of labor costs in Spain, and show hat they are not the cause of the Spanish economic mess. The ratio labor cost/average productivity of labor  has increased in Spain in the last years, but not as a consequence of increases in labor cost but due to the diminution of productivity.

Krugman´s views: We do not agree with the Krugman´s recommendation of diminution of wages in Spain, although we agree with him that the Spanish economy is in a mess. This is a kind of mess related with lack of support to industry. In spite of that Spain economy could have a good evolution in the next years if the country gets a good economic policy. I 
Some links to Krugman articles and comments by readers are the following ones:
An interesting analysis of the higher levels of productiviy and rates of employment in the United States, in comparison with European Union, is presented in the article by Guisan and Cancelo(2006) in the journal AEID, which is free downloadable. The conclusion, in section 5 of the article, are the following ones:

"5. European labour policies: suggestions and conclusionsThe lower rates of employment and wages in EU in comparison with the USA are due to  lower levels of industrial and non-industrial real value-added per inhabitant. Wages are not to be blamed as the cause of unemployment in EU countries, but the lack of policies to foster industrial development, research, education and other variables which explain the higher levels of the USA in comparison in Europe. It is clear that economic policies in the USA are more focused, than in the whole of the European Union, to the increase of real Gdp per inhabitant and employment. The successful development of those policies in Europe should imply more dialogue between policy makers and the European society, including economics researchers. Unfortunately thee Euro-sclerosis in the bureaucracies of some EU institutions have led to increase the distance between political parties and society... More industrial and regional development, less taxes on labour, and more support to education and scientific research in all the EU countries are convenient to diminish unemployment and stagnation and to reach real convergence with the USA regarding the increase of real wages and rates of employment at the same time."

These recommendations are of particular interest for Spain because industrial development and investment per capita is lower than in more adavanced European countries. It should be desirable more opportunities for economics researchers, who have something to say related with these questions, to present their opinions in the newspapers and other communication media.

2009/12/24

12. Euro-American Association on Education and Government Quality: Clerc´s story of a frog against social manipulation


Entry 12 by 
Maria-Carmen Guisan, Professor of Econometrics, Spain

Broken links to videos. To update in November of 2023

Readers may see the video in English in this entry or by clicking here. To see an interview in English to the author of the "story of a frog", the philosopher from Switzeralnd, Olivier Clerc, click here. There are other versions in  French, Spanish and Italian.

In entry 13 of our Spanish Blog there is also a link to a nice and interesting video on "Education in Finland", explaining how the educational level of population usually contributes to increase the quality of government, selection of advisors and voice of citizens  In the right column of that blog there are links to several videos related with economic development and quality of life.

The Video of the  "Story of a Frog" tell us about the importance of Citizens Voice in Government Quality. Education usually contributes to foster Citizens Voice and Government Effectiveness. Econometrics research also shows those positive effects. Educated population has an important role to avoid manipulation of public opinion and to foster good quality of life for all.
Home of the Blog: http://euroamericanassociation.blogspot.com/

2009/09/20

11. Report 2009: Years of Life Lost and Health Expenditure in the United States, Europe and other OECD countries. Euro-American Association of Economic Development Studies

We hope that controversies around Health assistance organization in the USA will achieve enough social agreement in order to allow all the populaltion to benefit from a good and affordable health assistance at least in the same degree that it happens in the major countries of Western Europe and other industrialized countries. It does not mean necessarity that public systems will substitute private health assistance, because each country may decide a mix of both public and private systems to operate in order to offer a good system to all the population.

In the interesting survey: "Education, Health and Economic Development: A Survey of Quantitative Economic Studies, 2001-2009, by Guisan, M.C. (2009)", published in our journal RSES Vol. 9-2, we analyze the relationship between "health expenditure per capita" and Years of Potential Life Lost. The article is free downloadable (clicking on the title to go to the Abstract page, and then on "download" within that page).

Graph 3. YPLLF (or PYLLF): Years of potential life lost per 100 thousand female population and Health expenditure per capita in OECD countries year 2005
Source: Elaborated by Guisan(2009) from OECD, WHO and WDI atistics. Health Expenditure per capita is expressed in dollars at 2005 prices and Purchasing Power Parities (PPPs).

Graph 4. YPLLM (o PYLLM): Years of potential life lost per 100 thousand male population and Health expenditure per capita in OECD countries, year 2005

Source: Elaborated by Guisan(2009) from OECD, WHO and WDI statistics Health expenditure per capita in Dollars at 2005 prices and Purchasing Power Parities (PPPs).


Potential Years of Life Lost, PYLL (also know as YPLL: Years of Potential Life Lost) is measured by the number of years of life lost by people who died below 70 years old, per each 100 thousand inhabitants), PYLLF refers to female population and PYLLM to male population. This variable usually diminish when health expenditure per capita increases, although other factors are also important to lower the level of this prematural deaths, such as those related with the facilities to use health assistance services, if necessary, by all the population in all the geographical and social areas of the country, and other ones related with other risks that experience population such as risky jobs, health habits of life, and other ones.

We notice that several factors, such as risky jobs and activities among other ones, play an important role to explain the big differences between PYLLM and PYLLF, as in all the analysed countries PYLLM was substantially higher than PYLLF. It is striking to notice that the United States has the highest value of health expenditure per head but much higher values of PYLLF and PYLLM than those which should correspond to the degree of expenditure and quality of health assistance. Accordingly to recent reports on health assitance improvements it is clearly desirable that the USA may reach lower values of PYLLM and PYLLF in the next years.

Education has generally a highly positive impact on real production per capita, and real production usually help to increase the level of health expenditure per head. The increase of health expenditure per capita usually leads, with proper organization, to clear increases in health welfare and to clear diminutions of potential years of life lost. It is good news the current reforms aimed to increase coverage of health insurance to many millions of Northamerican citizens who did not enjoy this important service until now.

Home of the Blog: http://euroamericanassociation.blogspot.com/