
Map of Coronavirus. Source: RTVE 2020
Update of 2nd June 2023

Update of 16th February 2022: Diminution of Decesased people by Covid19 in January of 2021: Data of Spain
The excess of deceased people, in comparison with January of 2019, has been lower in year 2022, after several months of vaccination, in comparison with January of 2021.
Statistics of INE: Accordingly to the National Instituto of Statistics (INE) the excess deaths of year 2021 in comparison with 2019 was 3161, and the excess deaths of year 2020 was 7355. The number of deathc by all causes in Spain in the first 4 weeks of year 2019 amounted to 39769, and thus the percentaje of extra deaths, mainly due to Covid19 was lower in year 2022 (close to 8%) than in year 2021 (18%).
Statistics of Ministry of Health. The number of extra deaths estimated by this administration eas also lower in January of 2022 (3636) than in January of 2021 (6975).
NOTE: We expect to update data of other countries when more statistics of extra deaths will be available.
Update of 8th May 2021.
Graph 3. Diminution of average weekly death rates, by Covid19, per 100 thousand inhabitants in 8 OECDCountries: UK, USA, Germany, Mexico, Italy, Switzerland, France and Spain, in the first months of year 2021.

The vertical axis is the average weekly number of deaths of Covid19, per 100 thousand inhabitants, and the horizontal axis indicates de Month of year 2021: 1. January. 2. February. 3. March, 4. April and 5. May (in May the data correspond to the first week).
The effects of vaccines has implied an important drop in the rate of weekly deaths in the these 8 countries. The diminution in the weekly rates of deaths, per one thousand people, from January to the first week of May of 2021, has evolved as follows:
UK from 11.06 to 0.12, The biggest diminution of these countries (10.94)
USA from 6.68 to 1.33: diminution 5.35.
Germany from 6.35 to 1.86: diminution 4.48.
Mexico from 5.79 to 1.16: diminution 4.63.
Italy from 5.38 to 2.82: diminution 2.55.
Switzarland from 4.59 to 0.85: diminution 3.73.
France from 3.85 to 2.32: diminution 1.52
Spain from 3.57 to 1.42: diminution 2.15
Source of data. The graph was elaborated by Professor Maria-Carmen Guisan, coordinator of this Blog of World Development, with data from EP Data (Europa Press data) for deaths and data of population fron the World Bank, the Census Beaureau of the US and the Spanish National Institute of Statistics (INE).
Graph 4 shows the evolution of each country in the period January-May and the set of 8 OECD countries (weighted averages of 8 countries).
Graph 4. Average weekly rates of death of Covid-19, by 100 thousand inhabitants
since January to the first week of May of 2021

Update of 5th April of 2021
We have included, in other Blogs of our Euro-American Association, more information about the pandemia of Coronavirus and economic crisis of years 2020 and 2021, including graphs with the vaccines effect on the diminution of deaths since the first quarters of year 2021. Some outstanding Entries in this regard are the following ones:
Entry 42 of the the Blog Foro-Unives-2010 (in English) with information about Katalin Karikó, the Hungarian researcher working the United States who, after 40 years of hard work, opened the door to great advances on mRNA and its application in Medecine, including Coronavirus vaccines.
Blog of Spanish Economy (in Spanish): Entries 83 (of year 2021) and 79 (of year 2020) on Coronavirus in Spain, with particular attention to the quality of data.
Blog of Latin America and International Economy (in Spanish): Entry 41 and other ones.
Update of 31st December of 2020
We include two graphs corresponding to the average of montly percentages of "excess of deaths" in 30 European countries. One graph corresponds to the months of January-May of 2020 and the other one to the months of June-October, accordingly to European Data.
Graph 1. Excess of deaths in 30 European countries: January-May of 2020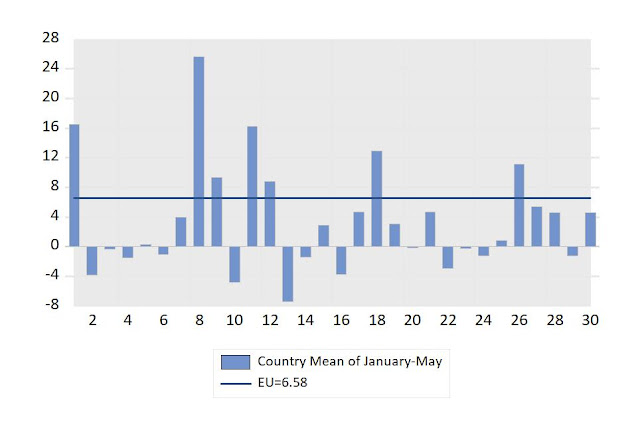


The order of countries is as follows:
1 Belgium. 2 Bulgaria, 3 Czechia,
4 Denmark, 5 Germany, 6 Estonia, 7 Greece, 8 Spain, 9 France, 10 Croatia, 11 Italy, 12, Cyprus, 13 Latvia, 14 Lithuania,
15 Luxembourg, 16 Hungary,17 Malta, 18 Netherlands, 19 Austria, 20 Poland, 21 Portugal, 22 Romania, 23 Slovenia ,24 Slovakia,25
Finland, 26 Sweden, 27 Iceland, 28 Liechtenstein, 29 Norway, 30 Switzerland

Suggested citation for this article: Garg S, Kim L, Whitaker M, et al. Hospitalization Rates and Characteristics of Patients Hospitalized with Laboratory-Confirmed Coronavirus Disease 2019 — COVID-NET, 14 States, March 1–30, 2020. MMWR Morb Mortal Wkly Rep 2020;69:458–464. DOI: http://dx.doi.org/10.15585/mmwr.mm6915e3external icon.
First period (January-May of 2020): the highest percentages of Excess of Deaths corresponded to countries: 8 (Spain), 1 (Belgium), 11 (Italy), 18 (Netherlands) and 26 (Sweden).
Second period (June.October of 2020): the highest percentages of Excess of Deathis corresponded to countries: 3 (Czechia), 20 (Poland), 22 (Romania), 8 (Spain), 21 (Portugal) and 17 (Malta).
Update of 6th September: Preventive measures
Diminution of Lethality Rate (% of deaths on the number of cases of Coronavirus) seems to decrease after preventive measures. For example in Spain the Letality Rate from 10th March to 10th May was estimated, accordingly to the "update of 1st June of 2020", in this Entry of the Blog, as 1.8%, and provisional data for the period 10th May to 28 thAugust of 2020, allows an estimated Lethality Rate of 1.2%.
Diminution of Mortality Rate per week (% of excess deaths on total population) was around 0.09% for a period of 10 weeks until 10th May, what means 0.009% per week (as to say an average of 4300 deaths per week).
For the period of 13 weeks after 10th May until the second half of August, the total number of deaths was estimated between 591 (registered data) and 2500 (provisional estimation of excess of deaths), what means a mortality rate between 0.001 and 0.005 for 13 weeks, with an estimated average per week betweenof 0.00008 0.0004.
Update of 1st June of 2020
The number of excess deaths registered by the statistics is helping us to know the real magnitude of the Coronavirus cost of human lives. In the case of Spain the figures of extra deaths, in comparison with previous years, is around 43000, most of them due to Coronavirus. This implies a Lethality Rate of 1.8% (percentage of Deaths on Total 2355000 Cases of contagious accordingly to Seroprevalence Tests).
We expect to calculate Lethality Rates for other countries, having into account extra deaths and seroprevalence tests. UK government have estimates of seroprevalence from tests to blood donors, as published on 285th May of 2020.

Source: Public Health. England. Research and analysis
Sero-surveillance of COVID-19
We expect to have an estimator of the average rate of seroprevalence at national level.
Update of 23rd May 2020
The need to support scientific researchers in the fight against Coronavirus: To avoid sanitary and economic crisis of high magnitude, as the crisis of Coronavirus in year 2020, Governments and Institutions should provide the necessary resources to good scientifics that could have developed vaccines of prevention or advances for medical treatment. Here there are interesting testimonies of highly qualified researchs demanding more resources in this regard.
|
|
Inside the Frantic—and Frustrating—Race to
Develop a COVID-19 Vaccine in Texas
|
 Co-Directors Texas Children's Hospital Center for Vaccine Development
“We have the experts in Texas, we have the facilities in Texas, we have the virus here, and we have the clinical people who can do the studies,” said Bottazzi, her voice rising in frustration. She is the co-director of Texas Children’s Hospital’s Center for Vaccine Development and associate dean of the National School of Tropical Medicine at the Baylor College of Medicine. “We have the largest medical center in the world, and with all this combined, we should already have had this vaccine in the human population.”
Hotez, her co-director and dean of the NSTM, agreed. A normally affable scientist, he’d begun to appear angrier than might be expected for a man who favors polka-dot bow ties. That’s because, despite all of his and Bottazzi’s credentials and the urgency of the moment; despite their appeals to health officials, Congress, and the public; despite their needing only $3 million to pull the vaccine out of the freezer and start testing on people, they were stuck. Rather than leading the fight against COVID-19 from their lab, they were waging a daily battle, in emails and phone calls, against bureaucracy."
More information: In Entry 41 of our Blog in Spanish, on International Development, we include a link to intresting interviews in Spanish to Doctora Maria-Elena Bottazzi in BBC and in BronxNet TV.
|
Year 2020 will have many changes in Economy. Besides the challenge of measures to preven environmental damage of the Globe, we must face the new pandemic problem that have arisen with the Coronavirus Covid-19.
It is remarkable that Governments and other institutions should show more support to researchers who work to prevent diseases and to offer more quality of life to people, both in underdeveloped and developed countries. Sometimes scientific researchers that have a good record of high quality do not receive enough support or must spent too many hours devoted to get financial aid, instead of have more time for their interesting research activities. A lesson of this pandemic should be to increase support to good researchers with good projects, particularly in the fields that good lead to present sanitary problems and avoid diseases and deaths.
Here there are some examples of scientific research addresed to get a vaccine for Coronavirus that had experiences important delays and distress due to the lack of financial support until now. The emergency of this year has contributed to increase the help and we will be very fortunate if the solutions to this problem come soon.
Update of 16th May 2020
On 14th May appeared information about "excess deaths", likely by Coronavirus, in several European countries, as in Voz de Galicia. Accordingly to that figures and supposing that the lethality rate would be similar to the figures of Spain and New York, with a number of deaths between 1.27% and 1.4%, the total cases shooul be revised an would be much higher than the provisional official numbers. In the case of Spain, for example the number of confirmed tests in the provisional statistics was around 200 thousand, but the estimaded cases of contagious, accordingly to the serological test of a sample of the Spanish population in all the regions was more than 2 million people.
The lethality Rate of Coronavirus seems to be 10 times higher than that of the Flu, at least with the figures of the United States. Accordingly to CDC, the Rate is 0.14 % of deaths among total Cases of Flu (or 1.4 per thousand Cases), while, accordingly to the Lethality Rate of Coronavirus with the Data of New York, there is a Rate of 1.4% of deaths among Cases of Covid-19 (or 14 per thousand Cases).
To be updated with a table
Update of 14th May 2020
Revision of the Lethality Rate of Spain and New York City after serological tests.
Many countries will have revised data of Coronavirus, during the next weeks and months, which it is expected will provide a more realistic Lethality Rate or Case Fatality Rate (CFR), as to say a more realistic % of Deaths among total Cases that have been affected by Coronavirus. For example in the case of Spain, the data of 7th of May, that appear in table 1, can be revised, because the serological study, published today, provide an estimation of 5% of population affected by Coronavirus, what is more than 2 million people (2355000), instead of the 220325 that appears in Table 1 of this Entry. On the other hand we have not yet a definitve number of Deaths by Coronavirus, but quantification of extra-deaths, in comparison with previous years, indicate that around 30 thousand deaths might be due to Coronavirus in Spain for the months of March and April, instead of 25857 that appear in table 1. The Lethality Rate of Spain with 30000 deaths among 2355000 affected people, is 1.27% instead of 11.74% of table 1 of this Entry of the Blog.
Columns (1) to (5) should be, in case of confirmation of this revised data of Spain (with a population around 47.1 million), as follows:
(1) Total Cases of Spain: 2355000
(2) Deaths: 30000 (see update of 1st June of 2020)
(3) Cases per one million inhabitants: 50000
(4) Deaths per one million inhabitants: 637
(5)Lethality Rate or Case Fatality Rate (CFR): 1.27% (percentage of Deaths on Cases).
The figures for New York City (with a population of 8398748 inhabitants), published on 14th May of 2020 by Worldometers, indicate the following revision after serological tests, and having into account excess death analysis, until 1st may of 2020:
(1) Total Cases of New York City: 1671351
(2) Deaths: 23430
(3) Cases per million inhabitants: 199000
(4) Deaths per million inhabitants: 2790
(5) Lethaly Rate or Case Fatality Rate (CFR): 1.40% (percentage of Deats on Cases)
Entry 42: Post of 12th May 2020
We have selected data from reliable sources, although in many cases the information is only provisional and we expect to revise it if there are statistical revisions in the next months. This is a Report of the Euro-American Association of Economic Development Studies, written by Professor Maria-Carmen Guisan (Economist, Honorary Professor of Econometrics at USC, Spain). Our main aim is to show that Health Economics is important for every day life and particular in years like 2020 with high peaks in the number of patients demanding, simultaneourly, Hospital Resources. We have written about the importance of increasing the number of medical doctors, nurses and other sanitary workers in Spain and in many countries. At the end of this entry we will include links to other Entries of this Blog related with this topic.,
We highlight the following questions.
1) Data of Coronavirus from Our World In Data (OWID) (Oxford, UK). That interesting Website includes data by day of cases, deaths and related variables. From this source we have calculated the percentage of Deaths on the number of Cases.
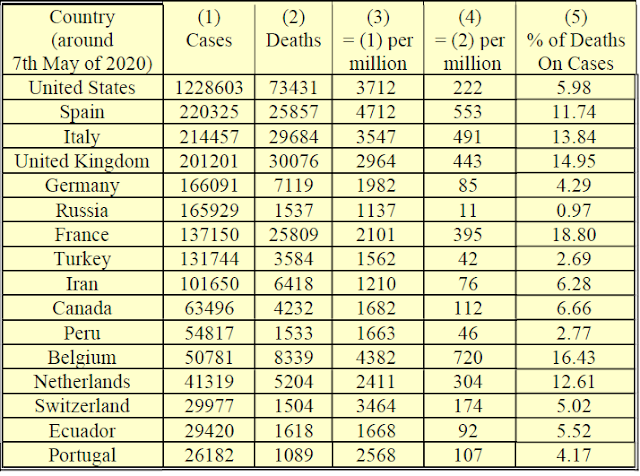
Table 1 shows a list of countries with more than 25000 Cases and more than 1000 Cases of Patients of Coronavirus confirmed per million people. Criteria for confirmation is usually related to positive results in PCR tests, but there are many differences among countries because some of them test people with and without syntoms and other ones only to people with severe syntoms.
Table 1. Countries with more than 25000 total cases, of people affected by Coronavirus, and with more than 1000 cases, of Coronaviurs, per one million inhabitants.

Source: Colums (1) to (4) from OWID, Column (5) own calculation. Data correspond to 7th May, but in the case of Spain to 6th May. Notes: Confirmed Deaths may be undervalued in some cases in countries that do not compute, or only partially, deaths outside Hospital institutions (at home, residences, etc.) or for other reasons. Total Cases (column (1)) may be highly undervalued in countries where PCR tests where applied only to severe cases). High values in column (5) may be due to undervalues of total Cases. See update of 14th May above, for the case of Spain with an estimation of 5%, instead of 11.74%, after serological tests.
The highest rates of confirmed Deaths per million people, in table 1, correspond to Belgium, Spain, Italy, United Kingdom, France and Netherlands.
The percentage of Deaths on the number of Cases varies between 5 and 19 in 11 out of the 16 countries. The differences may be due to different stages in the evolution of the pandemie, or to statistical problems related with total cases (undervalued or overvalued) and number of Deaths (some statistics may refere only to Hospital Deaths while others include out of Hospital deaths (home, residence, etc.) or to other problems.
Table 2. Countries with more than 25000 Cases of Coronavirus and less than 1000 cases per one million inhabitants.
Country, 7th May of 2020
|
(1)
Number
of Cases |
(2)
Deaths
|
(3)
= (1) per
million
|
(4)
= (2) per
million
|
(5)
% de Death
on Cases
|
Brazil
|
125218
|
8536
|
589
|
40
|
6.79
|
China
|
83970
|
4637
|
58
|
3
|
5.17
|
India
|
52952
|
1783
|
38
|
1
|
2.63
|
Saudi Arabia
|
31938
|
209
|
917
|
6
|
0.65
|
Mexico
|
27634
|
2704
|
214
|
21
|
9.81
|
Source: Colums (1) to (4) from OWID, Column (5) own calculation. Notes: Data correspond to 7th May. Confirmed Deaths may be undervalued in some cases in countries that do not compute, or only partially, deaths outside Hospital institutions (at home, residences, etc.) or for other reasons. Number of Cases may be undervalued. High values of colum (5) may be due to undervalue of Number of Cases, as indicated at the footnote of table 1.
2) Data of Coronavirus from the Institute for Health Metrics and Evaluation (IHME), (Seattle, WA, USA). Includes interesting graphs and data, by country, of Hospital Resources, including hospital beds, Intensive Care Units (ICU) beds, and Ventilators. This Webpage shows graphs of deaths per day and total deaths for the first months of year 2020 and projected until August. An important question in this regard is to compare supply and demand of ICU beds and ventilators. In some countries demand has been higher that the initial supply and it has required a lot of quick actions and efforts to increase supply and meet the needed resources. This has implied a great effort for the sanitary specialists of that units. A lesson form several countries is that there is necessary to provide more human and material resources to that units in order to avoid collapses in future health picks and crises.
A summary of data of Hospital Resources for a few countries of table 1, appear in table 3.
Table 3. Hospital beds, ICU beds and Ventilators at peak of ICU beds
needs.
Hospital beds
available
|
Hospital beds
needed at peak
|
ICU beds
available
|
ICU beds
needed at peak
|
Ventilators
needed at peak
|
|
France
|
97738
|
22663
|
1828
|
7071
|
6470
|
Germany
|
133049
|
6344
|
5202
|
2018
|
1843
|
Italy
|
42727
|
21321
|
1634
|
6895
|
6313
|
Spain
|
31266
|
23736
|
1271
|
7235
|
6696
|
UK
|
27514
|
28089
|
3543
|
8445
|
7681
|
USA
|
-
|
60016
|
-
|
18071
|
16421
|
Source: Data from IHME. Notes: We tried to include the 9 countries of table 1 with more than 100000 cases, but data were available only for 6 of them. The peak of ICU beds needed corresponded to the following dates: France (4th April), Germany (16th April), Italy (29th March), Spain (30th March), UK (14th April) and USA (18th April)
3) Some Indicators of Coronavirus in Spain and Comparison with the United States: Distribution by Age.
TO BE UPDATED SOON
4) Other Data of Health Care Resources.
3) Some Indicators of Coronavirus in Spain and Comparison with the United States: Distribution by Age.
It is well known that Coronavirus death rates increase with age, particularly for population older than 80 years. Here we include a table comparing the cases of Spain and the United States with data that have been published by the Ministery of Health in Spain, for all the regions, and in the following sources for the United States:
Article by, Garg S, Kim L, Whitaker M, et al (2020) for the United States (See reference below in section 5) of Selected Readings). These authors analyze the distribution by age for 14 states.
Wikipedia, a list of 25 regions with data of Cases and Hospitalization in the the United States. Update of 7th of May 2020
at the Entry: "Wikipedia-Covid19-Pandemic in the United States"
TO BE UPDATED SOON
4) Other Data of Health Care Resources.
a) World Development Indicators, from World Bank: it includes data of Hospital beds per 10000 people, and Medical Doctors per 10000 people as well as data of Expenditure on medical care (public and private).
b) Health Report of World Health Organization (WHO) of year 2019 includes in the Annex 2, pages 108, 110 and 112, data of
Density
of medical doctors x (per 10 000 population) Density of nursing and midwifery
personnel x (per 10 000 population) Density of dentists x (per 10 000
population) Density of pharmacists x (per 10 000 population), among other indicators.
c) Other sources for World comparisons: Wikipedia and Index Mundi, present some interesting data based on World Health Organization, country sources and other ones. The list of Wikipedia includes ICU beds per 100000 people for more than 35 countries. The list of Index Mundi, includes Medical Doctors ratio to population for many countries and territories.
5) Selected readings on Health Economics related with Hospital Resources and Coronavirus
Corresponding authors:
Shikha Garg, izj7@cdc.gov, 404-639-6142; Lindsay Kim, iyn2@cdc.gov, 404-639-5218.
Suggested citation for this article: Garg S, Kim L, Whitaker M, et al. Hospitalization Rates and Characteristics of Patients Hospitalized with Laboratory-Confirmed Coronavirus Disease 2019 — COVID-NET, 14 States, March 1–30, 2020. MMWR Morb Mortal Wkly Rep 2020;69:458–464. DOI: http://dx.doi.org/10.15585/mmwr.mm6915e3external icon.
Analysis of ICU beds resources in Spain: Article available in English and Spanish.
Medicina Intensiva, Vol. 37. Issue 7.
pages 443-451 (October 2013
a Servicio de Medicina Intensiva, Hospital Universitario de Torrejón, Torrejón de Ardoz, Madrid, Spain
b Unidad Clínica de Cuidados Críticos y Urgencias, Hospital Universitario de Valme, Universidad de Sevilla, Sevilla, Spain
d Servicio de Medicina Intensiva, Hospital Severo Ochoa, Leganés, Madrid, Spain
Articles at Ideas-Repec. related with 'Coronavirus Hospital', many of them free downloadable:
- Mohammad Reza Farzanegan & Mehdi Feizi & Hassan F.
Gholipour (2020): Globalization and outbreak of COVID-19:
An empirical analysis
The purpose of this study is to examine the
relationship between globalization, Coronavirus Disease 2019 (COVID-19)
cases, and associated deaths in more than 100 countries. Our ordinary least
squares multivariate regressions show that countries with higher levels of
socio-economic globalization are exposed more to COVID-19 outbreak.
Nevertheless, globalization cannot explain cross-country differences in COVID-19
confirmed deaths. The fatalities of coronavirus are mostly
explained by cross-country variation in health infrastructures (e.g., share of
out of pocket spending on health per capita and the number of hospital beds)
and demographic structure (e.g., share of population beyond 65 years old in
total population) of countries. ... This finding provides the first empirical
insight on the robust determinants of COVID-19 outbreak and its
human costs across countries.
RePEc:mar:magkse:202018
RePEc:mar:magkse:202018
- Eric Kemp-Benedict (2020): Macroeconomic impacts of the public
health response to COVID-19
The economic impact of public health measures to
contain the COVID-19 novel coronavirus is a matter
of contentious debate. ... The post-Keynesian macroeconomic sub-model is a
stylized representation of the United States economy with three sectors: core,
social (most impacted by social distancing), and hospital, which
may experience excessive demand.
RePEc:pke:wpaper:pkwp2011
RePEc:pke:wpaper:pkwp2011
- Martin Gustafsson (2020): How does South Africa’s Covid-19
response compare globally?
The dataset is known as the Oxford COVID-19
Government Response Tracker, or OxCGRT. ... Having fewer hospital beds
relative to the population is associated with a more stringent response, for
instance. ... If one examines the lag between a country’s first Covid-19
case and workplace restrictions of maximum stringency, South Africa was about
average. Absolute numbers of deaths, or Covid-19 deaths relative to
how many deaths a country could have expected anyway in 2020, provide what is
probably the best basis for comparing, across multiple countries, the speed
with which Covid-19 multiplies. There is clearly a large variety of
trajectories for Covid-19 deaths across countries.
RePEc:sza:wpaper:wpapers342 Save to MyIDEAS
RePEc:sza:wpaper:wpapers342 Save to MyIDEAS
- Miguel Casares & Hashmat Khan (2020): A Dynamic Model of COVID-19:
Contagion and Implications of Isolation Enforcement
We present a dynamic model that produces day-to-day
changes in key variables due to the COVID-19 contagion: both
accumulated and currently infected people, deaths, recovered, and infected
people who require hospitalization. The model is calibrated to the COVID-19
outbreak in Spain and it is able to replicate fairly well the observed series
of daily deaths. Next, the effects of isolation enforcement are examined and we
find that the Spanish government’s declaration of the State of Alarm (March
14th, 2020) is estimated to have cut the number of deaths by 92.5% and the
number of hospital beds needed by 95%, relative to the no
intervention scenario.
RePEc:car:carecp:20-02
RePEc:car:carecp:20-02
- David Gershon & Alexander Lipton & Hagai Levine
(2020): Managing COVID-19
Pandemic without Destructing the Economy
We analyze an approach to managing the COVID-19
pandemic without shutting down the economy while staying within the capacity of
the healthcare system. ... We model the healthcare capacity as the total number
of hospital and ICU beds for the whole country.
RePEc:arx:papers:2004.10324 Save to MyIDEAS
RePEc:arx:papers:2004.10324 Save to MyIDEAS
- Andree,Bo Pieter Johannes (2020): Incidence of COVID-19 and Connections
with Air Pollution Exposure : Evidence from the Netherlands
The fast spread of severe acute respiratory
syndrome coronavirus 2 has resulted in the emergence of
several hot-spots around the world. ... This study investigates the
relationship between exposure to particulate matter and COVID-19
incidence in 355 municipalities in the Netherlands. The results show that
atmospheric particulate matter with diameter less than 2.5 is a highly
significant predictor of the number of confirmed COVID-19 cases and
related hospital admissions. The estimates suggest that
expected COVID-19 cases increase by nearly 100 percent when
pollution concentrations increase by 20 percent. ... The findings call for
further investigation into the association between air pollution and SARS-CoV-2 infection
risk.
RePEc:wbk:wbrwps:9221
RePEc:wbk:wbrwps:9221
- Andre Maia Chagas & Jennifer C Molloy & Lucia L
Prieto-Godino & Tom Baden (2020): Leveraging open hardware to alleviate the burden
of COVID-19 on global health systems
With the current rapid spread of COVID-19,
global health systems are increasingly overburdened by the sheer number of
people that need diagnosis, isolation and treatment. Shortcomings are evident
across the board, from staffing, facilities for rapid and reliable testing to
availability of hospital beds and key medical-grade equipment.
... Here, we summarise community-driven approaches based on Free and Open
Source scientific and medical Hardware (FOSH) as well as personal protective
equipment (PPE) currently being developed and deployed to support the global
response for COVID-19 prevention, patient treatment and
diagnostics.In light of the Covid-19 pandemic, this Community Page
article discusses the projects, pitfalls and possibilities regarding open
source personal protective equipment, ventilators and diagnostics.
RePEc:plo:pbio00:3000730
RePEc:plo:pbio00:3000730
- Umesh Adhikari & Alexandre Chabrelie & Mark Weir &
Kevin Boehnke & Erica McKenzie & Luisa Ikner & Meng Wang &
Qing Wang & Kyana Young & Charles N. Haas & Joan Rose &
Jade Mitchell (2019): A Case Study Evaluating the Risk of
Infection from Middle Eastern Respiratory Syndrome Coronavirus (MERS‐CoV) in a Hospital Setting
Through Bioaerosols
Middle Eastern respiratory syndrome, an emerging viral
infection with a global case fatality rate of 35.5%, caused major outbreaks
first in 2012 and 2015, though new cases are continuously reported around the
world. Transmission is believed to mainly occur in healthcare settings through
aerosolized particles. This study uses Quantitative Microbial Risk Assessment
to develop a generalizable model that can assist with interpreting reported
outbreak data or predict risk of infection with or without the recommended
strategies. The exposure scenario includes a single index patient emitting
virus‐containing aerosols into the air by coughing, leading
to short‐ and long‐range airborne exposures for other patients in the
same room, nurses, healthcare workers, and family visitors. Aerosol transport
modeling was coupled with Monte Carlo simulation to evaluate the risk of MERS
illness for the exposed population.
RePEc:wly:riskan:v:39:y:2019:i:12:p:2608-2624
RePEc:wly:riskan:v:39:y:2019:i:12:p:2608-2624
- Shenglan Xiao & Yuguo Li & Tze-wai Wong & David S C Hui
(2017): Role of fomites in SARS transmission during the
largest hospital outbreak in Hong Kong
Our results reveal that under the assumed conditions,
the SARS coronavirus was most possible to have spread via the
combined long-range airborne and fomite routes, and that the fomite route
played a non-negligible role in the transmission.
RePEc:plo:pone00:0181558
RePEc:plo:pone00:0181558
- Youting Guo & Jason Shachat & Matthew J. Walker & Lijia
Wei (2020): Viral Social Media Videos Can Raise Pro-Social
Behaviours When an Epidemic Arises
Shortly after the outbreak of the COVID-19
virus in Wuhan, China, we conducted an experiment assessing the impact of viral
videos on individual preferences and pro-social behaviour. Prior to the
experiment, participants viewed one of three videos culled from Chinese social
media: a central government leader visiting a local hospital and
supermarket, health care volunteers transiting to Wuhan, or an emotionally
neutral video unrelated to the emergency.
RePEc:chu:wpaper:20-15
RePEc:chu:wpaper:20-15
- Shenglan Xiao & Yuguo Li & Tze-wai Wong & David S C Hui (2017): Role of fomites in SARS transmission during the largest hospital outbreak in Hong Kong
Our results reveal that under the assumed conditions, the SARS coronavirus was most possible to have spread via the combined long-range airborne and fomite routes, and that the fomite route played a non-negligible role in the transmission.
RePEc:plo:pone00:0181558 - Youting Guo & Jason Shachat & Matthew J. Walker & Lijia Wei (2020): Viral Social Media Videos Can Raise Pro-Social Behaviours When an Epidemic Arises
Shortly after the outbreak of the COVID-19 virus in Wuhan, China, we conducted an experiment assessing the impact of viral videos on individual preferences and pro-social behaviour. Prior to the experiment, participants viewed one of three videos culled from Chinese social media: a central government leader visiting a local hospital and supermarket, health care volunteers transiting to Wuhan, or an emotionally neutral video unrelated to the emergency.
RePEc:chu:wpaper:20-15 - Sarah Shalhoub & Fahad Al-Hameed & Yasser Mandourah & Hanan H Balkhy & Awad Al-Omari & Ghaleb A Al Mekhlafi & Ayman Kharaba & Basem Alraddadi & Abdullah Almotairi & Kasim Al Khatib & Ahmed Abdulmomen & Ismael Qushmaq & Ahmed Mady & Othman Solaiman & Abdulsalam M Al-Aithan & Rajaa Al-Raddadi & Ahmed Ragab & Abdulrahman Al Harthy & Eman Al Qasim & Jesna Jose & Ghassan Al-Ghamdi & Laura Merson & Robert Fowler & Frederick G Hayden & Yaseen M Arabi (2018): Critically ill healthcare workers with the middle east respiratory syndrome (MERS): A multicenter study
Background: Middle East Respiratory Syndrome Coronavirus (MERS-CoV) leads to healthcare-associated transmission to patients and healthcare workers with potentially fatal outcomes. ... Median number of days from hospital discharge until the questionnaires were filled was 580 (95% CI 568, 723.5) days. ... Hospital mortality rate was substantial (25%).
RePEc:plo:pone00:0206831 - David Berger & Kyle Herkenhoff & Simon Mongey (2020): An SEIR Infectious Disease Model with Testing and Conditional Quarantine
Testing at a higher rate in conjunction with targeted quarantine policies can (i) dampen the economic impact of the coronavirus and (ii) reduce peak symptomatic infections—relevant for hospital capacity constraints.
RePEc:hka:wpaper:2020-017 - David W. Berger & Kyle F. Herkenhoff & Simon Mongey (2020): An SEIR Infectious Disease Model with Testing and Conditional Quarantine
Testing at a higher rate in conjunction with targeted quarantine policies can (i) dampen the economic impact of the coronavirus and (ii) reduce peak symptomatic infections—relevant for hospital capacity constraints.
RePEc:nbr:nberwo:26901